Subscribers to iSPYETF’s free e-mail newsletter receive a market outlook, usually once a week. The market outlook below was sent out on April 4, 2025. If you’d like to sign up for the free e-newsletter, you may do so here (we will never share your e-mail with anyone, just as we don't accept advertising).
A number or readers requested an update in light of this week's stock market selloff. Here you go: The chart below outlines some of the developments we’ve been looking for, it's a bit technical, but that's what's kept us on the right side.
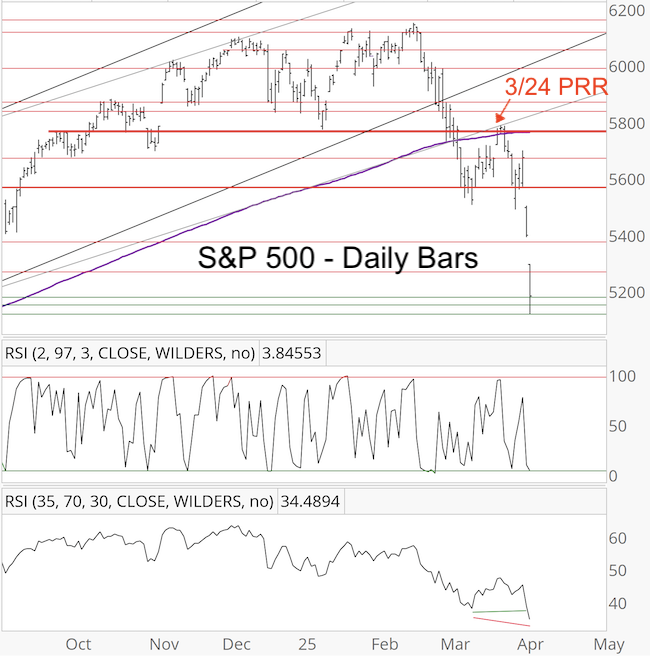
The S&P 500 lost 4.84% yesterday and closed at a new low (below the March 13 low at 5,521.52). There was a bullish RSI divergence at yesterday's low.
Those are almost the exact conditions we expected on March 19 (after the initial low), when the Profit Radar Report stated the following:
“The ‘ideal scenario’ would be another new low (around 5,450) with a bullish RSI-35 divergence (there is no such divergence at the March 13 low).”
On March 24, when the S&P 500 closed at 5,767.57 - which was just above obvious resistance (bold red line, chart below) and the widely watched 200-day SMA (see red arrow, chart below) - I published a special Profit Radar Report update with the warning that: “this push higher could be the market’s way to fool the crowd.”
The S&P started rolling over the next day … and fell to a new low along with a bullish RSI-35 divergence yesterday.
We almost got everything we were looking for in a tradeable low.
However, the S&P did close below important support at 5,450 yesterday. Why is that important?
In anticipation of what might be coming, I published more details about what to watch for when the S&P nears 5,450 in the March 30 PRR:
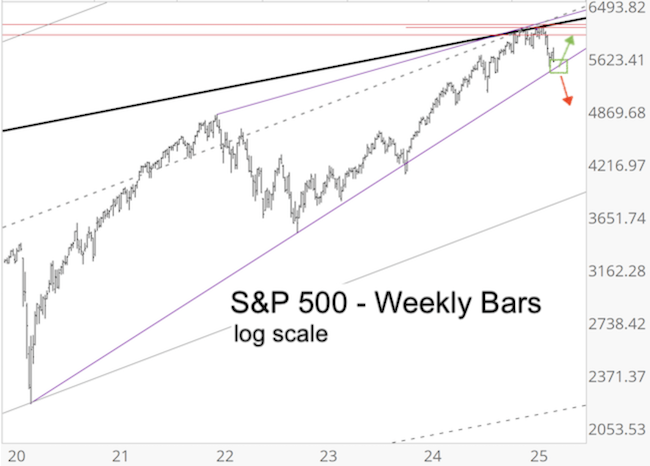
"Based on the weekly log chart, support around 5,450 seems important. The green box highlights where new lows with a bullish RSI-35 divergence would be most likely to take place.
If the S&P falls to new lows (below 5,521.52) there may be a window of 1-5 days where the S&P closes below 5,521.52 while RSI-35 does not go below it’s March 13 low.
During that bullish divergence window, we may be looking to buy.
However, if selling intensity starts to match or exceed the March 13 low, or if price does not find support in the green box, down side follow through could become quite nasty (red arrow)."
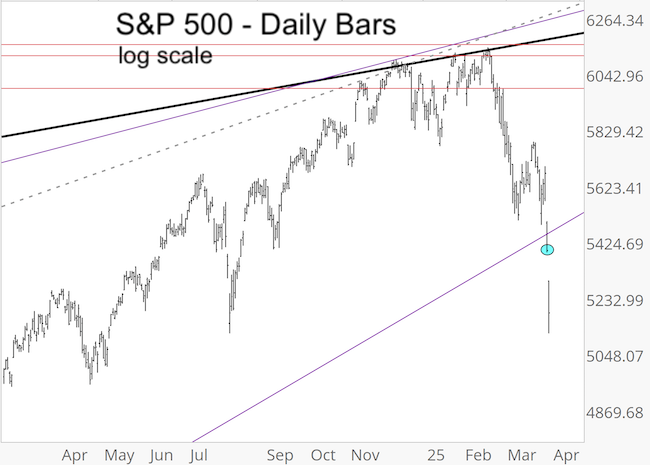
The chart below zooms in on the purple wedge support line (around 5,450). The S&P closed below it yesterday (blue circle), which - despite the bullish divergence that existed yesterday, but will likely be erased today - was a warning signal of "nasty down side follow through."
Summary:
The S&P did reach new lows, as expected. However, it also fell below important support around 5,450. As long as price is below this support, the nasty down side follow through can continue.
However, there's a big silver lining: The S&P 500 is virtually guaranteed to (eventually) rally and erase all of today’s, most of yesterday's, and any losses we may see in the coming days.
There are also some technical aspects starting to suggest a bounce.
This is a bold statement, but it's based on a little known trade secret with a 100% track record of accuracy over the past 25+ years.
For the trade secret that virtually guarantees an eventual recovery and objective, out of the box analysis, sign up for the Profit Radar Report.
The Profit Radar Report comes with a 30-day money back guarantee, but fair warning: 90% of users stay on beyond 30 days.
Barron's rates iSPYETF a "trader with a good track record," and Investor's Business Daily writes "Simon says and the market is playing along."
|
