Subscribers to iSPYETF’s free e-mail newsletter receive a market outlook, usually once a week. The market outlook below was sent out on September 12, 2024. If you’d like to sign up for the free e-newsletter, you may do so here (we will never share your e-mail with anyone, just as we don't accept advertising).
The S&P 500 has not made any net progress for 3 weeks, so we'll keep today's update brief, but interesting.
Although the range-bound choppiness and messiness is frustrating to watch, it is what we've been expecting. For example, the July 28 Profit Radar Report stated: "The wave 4 correction could last many months and be quite choppy."
Although the above outlook was already evidence based, I always keep checking the evidence to see if my forecast is on the right path. To that end, I just did the following exercise:
Identify other patterns that almost look like the current one, and - more importantly - see how the S&P 500 reacted.
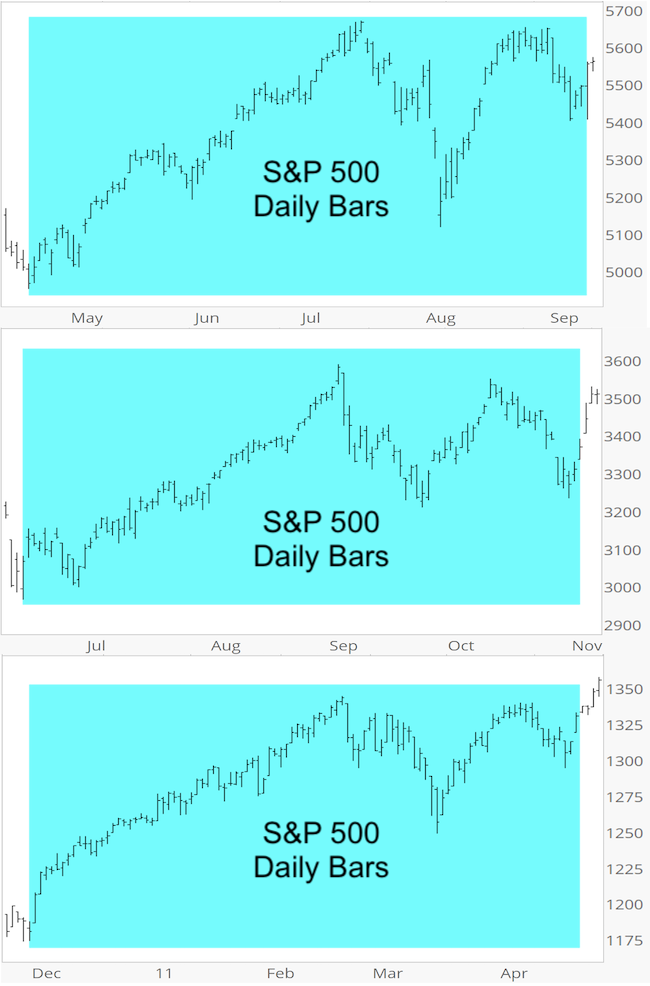
The first chart below shows the S&P 500 from April 19 - September 11 (blue box), which happens to be 100 trading days.
The next two graphs reflect the only two 100-day periods (over the past 25 years) that have a 95% or higher correlation to April 19 - September 11.
Now, this is the point where you might expect me to write something like "to see when this happened, sign up for the Profit Radar Report," ... but I won't.
Please find below the two 95% correlation precedents with dates and the S&P 500 performance for the following year.
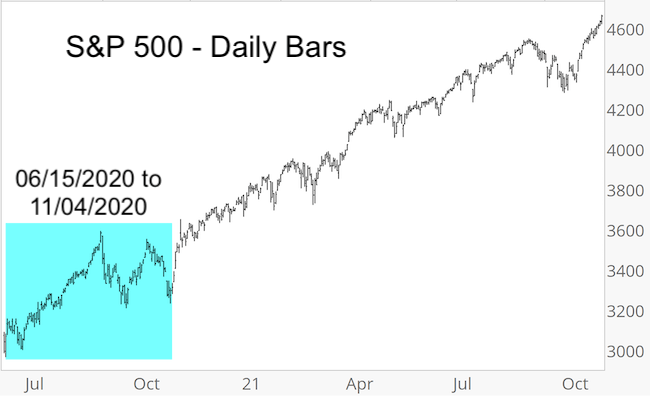
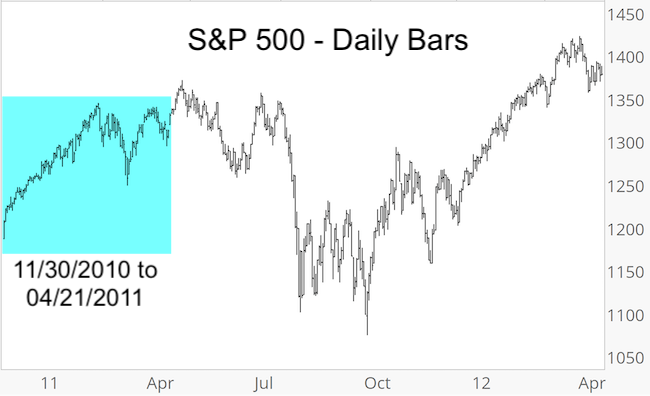
A sample size of two is way too small anyway, but there is also a wide discrepancy of outcomes. The 2020 precedent was followed by a continuous meltup. The 2011 precedent by a new high, continued choppiness and sizable correction.
The above study doesn't offer an edge, but it illustrates the process the Profit Radar Report consistently goes through to build, confirm (or adjust) the short-and long-term outlook.
For new readers, based on the weight of evidence, a 2011-like outcome seems more likely.
Looking at the short-term, S&P 500 risk would increase with new all-time highs.
A nice S&P drop before reaching new highs could be a good swing trade opportunity. If that were to happen, I would recommend buying the only major index ETF that still has an open chart gap (chart gaps are virtually guaranteed to be closed).
If you want to become the best-informed investor you know and base your decision only on objective and relevant analysis, check out the Profit Radar Report.
The Profit Radar Report comes with a 30-day money back guarantee, but fair warning: 90% of users stay on beyond 30 days.
Barron's rates iSPYETF a "trader with a good track record," and Investor's Business Daily writes "Simon says and the market is playing along."
|
