Subscribers to iSPYETF’s free e-mail newsletter receive a market outlook, usually once a week. The market outlook below was sent out on August 22, 2024. If you’d like to sign up for the free e-newsletter, you may do so here (we will never share your e-mail with anyone, just as we don't accept advertising).
The S&P 500 delivered an almost picture perfect V-bottom. An 8% drop followed by an 8% pop, all within about a month.
The only issue; it's not a correction or bear market bottom. A correction is commonly defined as a 10% drop, a bear market as 20% drop. The S&P didn't meet either criteria and was even above the 200-day SMA. Another first time ever event for the S&P 500.
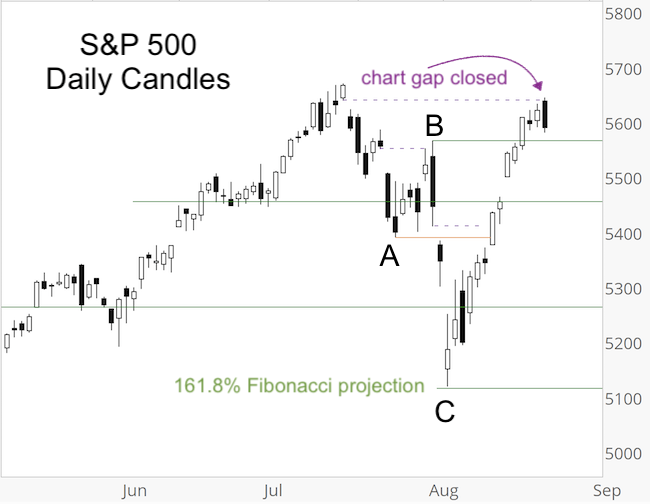
The last Free Market Outlook showed that the S&P 500 declined in 3 waves to the 161.8% Fibonacci projection target and stated:
"The question now is whether the decline is already finished (a correction can finish after 3 waves) or if it tags on waves 4 and 5."
Well, we got our answer in record time. Today, the S&P also closed the open chart gap at 5,639.02 (dashed purple line). The July 17 and 24 Profit Radar Reports highlighted this chart gap and pointed out that: "This gap will be closed, the question is how low the S&P will go before closing them."
The chart below shows the 3-wave decline (A, B, C) into the Fibonacci projection target and subsequent rally to close the open chart gap.
I did not expect the S&P 500 to rally that much that quickly, but my research showed clearly that the correction would only be temporary.
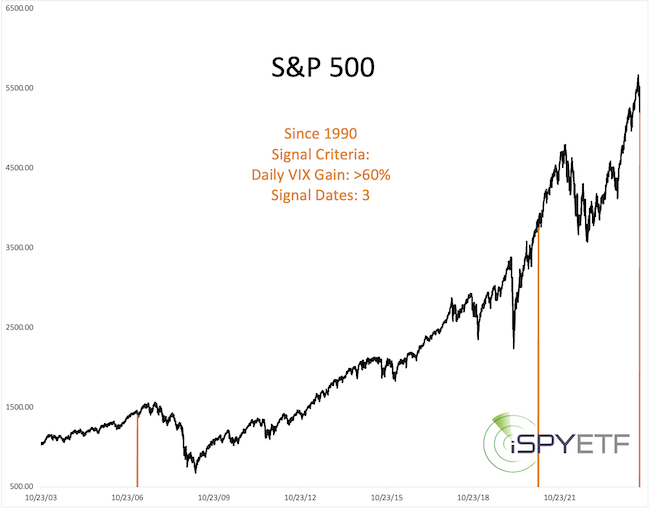
For example, on August 5, the VIX soared 64.90%. Since the deception of the VIX (1990), there were only 2 other daily gains >60%. None was bearish (at least not for the next year).
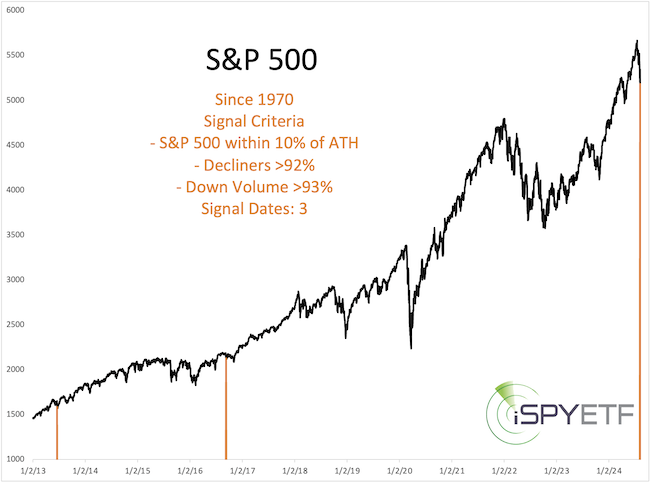
Also on August 5, the day of the low, 92.71% of NYSE-traded stocks declined on 93.69% of down volume.
There were only 2 other times (since 1970) when we saw this kind of down side breadth while the S&P was still trading within 10% of its all-time high. One was bullish, the other one gave way to a small short-term loss followed by big long-term gains.
We don't hitch our wagon to small sample size studies like the ones above, but guess what; We live in a small sample size environment.
Similar to weather patterns, the stock market is delivering once-a-decade or once-a-generation events every few months now and we just have to deal with it. We live in unprecedented times, and studies like the above help us to build a weight of evidence approach.
In July, the weight of evidence suggested that any losses will be retraced and followed by new all-time highs (or minimally closing of the chart gap at 5,639.02). The weight of evidence was correct.
What we didn't see, unfortunately, was a deeper correction with a better entry point to buy, at least not yet.
Although the weight of evidence is still bullish longer-term, I personally would not chase stocks at this moment. A re-test or break of the August lows is still possible, but a break below support is needed to unlock that possibility.
The Profit Radar Report is not always right (who is?), but the analysis provided is evidence and fact based, objective, and comprehensive enough to build a body of evidence that will generally point you in the right direction.
Test drive the Profit Radar Report and become the best-informed investor you know.
The Profit Radar Report comes with a 30-day money back guarantee, but fair warning: 90% of users stay on beyond 30 days.
Barron's rates iSPYETF a "trader with a good track record," and Investor's Business Daily writes "Simon says and the market is playing along."
Simon Maierhofer is the founder of iSPYETF and the publisher of the Profit Radar Report. Barron's rated iSPYETF as a "trader with a good track record" (click here for Barron's evaluation of the Profit Radar Report). The Profit Radar Report presents complex market analysis (S&P 500, Dow Jones, gold, silver, euro and bonds) in an easy format. Technical analysis, sentiment indicators, seasonal patterns and common sense are all wrapped up into two or more easy-to-read weekly updates.
|
