Subscribers to iSPYETF’s free e-mail newsletter receive a market outlook, usually once a week. The market outlook below was sent out on June 27, 2024. If you’d like to sign up for the free e-newsletter, you may do so here (we will never share your e-mail with anyone, just as we don't accept advertising).
The CBOE Volatility Index, or VIX, dropped below 12 last week, a nearly five year low. According to the Wall Street Journal, “investors fear long stretch of calm in markets can’t last.” It’s a worn Wall Street maxim that a complacent market is a dangerous market, but is it true?
Back in May, when the VIX closed at 11.93, I asked myself the same question, did some research, and published this in the May 22, Profit Radar Report:
“The chart below highlights all days when the VIX closed below 12. Although the 2 corrections in 2018 were preceded by sub-12 VIX readings, there still has not been a major market top accompanied by low (or sub 12) VIX readings. This may be counterintuitive for contrarians, but current VIX ‘complacency’ actually lends credibility to our longer-term bullish outlook.”

Pop! That’s a bubble bursting, but not a stock market bubble. Yet another another Wall Street maxim that’s been leading investors astray has been deflated: Low fear does not necessarily mean high risk.
Quick trivia: What was the VIX reading at the March 24, 2000 and October 11, 2007 S&P 500 all-time highs?
Drumroll … : 22.12 (3/24/2000) and 16.08 (10/11/2007). At those times, the VIX starting rising way before stocks were ready to fall.
The 'Godfather of divergences
As the VIX is hovering near 5-year lows, the stock market is also carving out some of the biggest divergences ever:
There is a massive Dow Theory divergence and the cumulative New York Composite advance/decline line (NYC a/d line) has failed to confirm the latest S&P 500 all-time highs. Both indicators have been around for a long time, and you can pick which one deserves the label ‘Godfather of divergences.’
We discussed the Dow Theory divergence in the last Free Market Outlook.
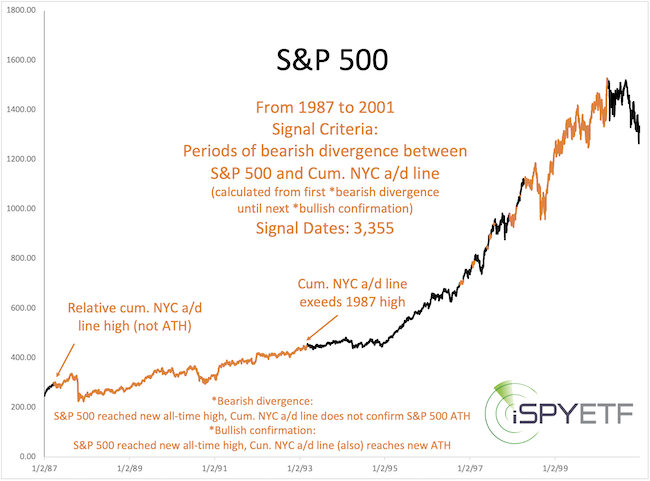
Here is some detail about the NYC a/d line divergence that you will not find anywhere else:
Currently, the divergence is 16 days old. This sounds menacing, and bearish divergences preceded the 1987, 2000 and 2007 market tops.
However, that’s only part of the truth, perhaps the only part discussed elsewhere. Here is the full truth:
Since the 1980s, there have been 19 other periods with divergences lasting longer than 16 trading days. 15 of those occurred after 2010.
The divergence before the current divergence lasted 585 trading days and ended on March 20, 2024 without ill effect on stocks.
Here is the chart that speaks more than 1,000 words:
Highlighted in orange are all the bearish divergences since 2007. Did some of them occur before corrections? Yes. But are they a reliable sell signal? You decide.
As you can see, the facts show that a number of supposedly bearish signs (low VIX, Dow Theory divergence, NYC a/d line divergence) are not reliable sell signals.
Does that mean everything looks bullish?
Bad Breadth at ATH
No. For example, at two recent S&P 500 all-time highs, more stocks declined than advanced and down volume was more than up volume. That certainly doesn't sound good and is very rare.
Something similar happened 18 other times (since 1970) when the S&P was within 1% of an all-time high, and only 1 other time when the S&P was at an all-time high with a bearish NYC a/d line divergence (detailed analysis and dates available via the June 23, Profit Radar Report).
Another worry is the chart below, published in the May 29, Profit Radar Report. On July 24, the two main rally legs from the 2020 low will reach equality.
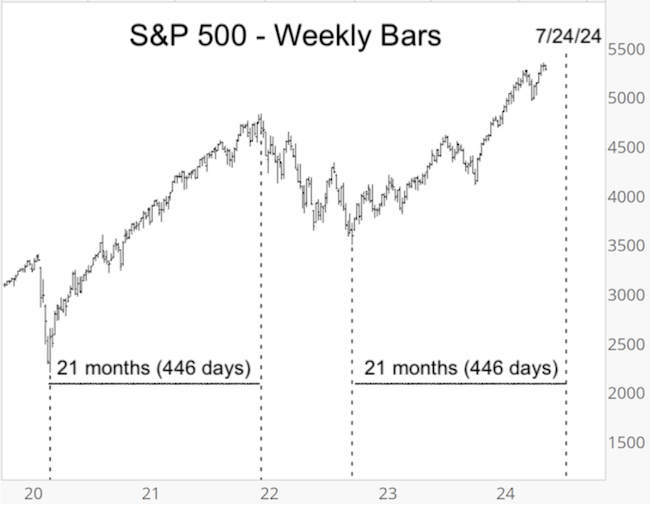
Timing relationships and projections are not usually very reliable, but this one has kept us from turning prematurely bearish as so many have.
More important than the timing component is the potential pattern that goes along with the timing implications. I've been following that pattern for quite a while, even outlined its path in the 2024 S&P 500 Forecast, and it still remains valid.
The exact pattern, along with minimum down side target and maximum allowed correction duration is discussed in the June 23, Profit Radar Report (sign up and view it here).
For continued updates, purely fact-based, objective, out-of-the box analysis check out the Profit Radar Report. You can test drive it here and become the best-informed investor you know.
The Profit Radar Report comes with a 30-day money back guarantee, but fair warning: 90% of users stay on beyond 30 days.
Barron's rates iSPYETF a "trader with a good track record," and Investor's Business Daily writes "Simon says and the market is playing along."
|
