Subscribers to iSPYETF’s free e-mail newsletter receive a market outlook, usually once a week. The market outlook below was sent out on June 6, 2024. If you’d like to sign up for the free e-newsletter, you may do so here (we will never share your e-mail with anyone, just as we don't accept advertising).
After stumbling in April, the S&P 500 and Nasdaq-100 hit another all-time high yesterday (not the DJIA and Russell 2000). The S&P ended the month of May with a year-to-date gain of 9.6%. Since 1970, the S&P gained more than 9% through the end of May 14 other years. How did it fare after similarly strong years?
The table below lists those years along with the corresponding June - December returns and maximum draw downs from the end of May until the end of the year.
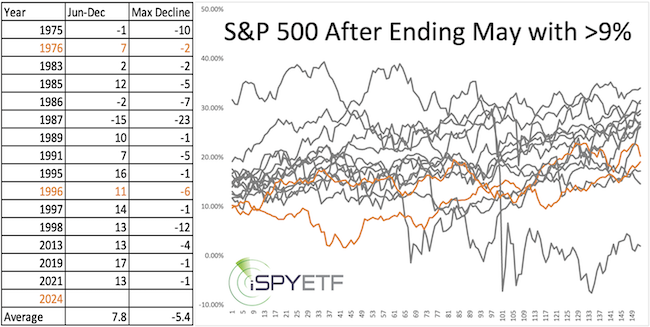
The graphs provide a visual of the June - December S&P trajectory. Except for 1975, 1986, and 1987, the S&P added to its gains every time by the end of the year.
Only 2 of the 14 precedents were also election years, 1976 and 1996 (highlighted in orange). After some volatility, the S&P added another 7% and 11% to its gains by year-end.
This is yet another study to suggest that strength begets more strength.
What about the glaring Dow Theory divergence?
For months there's been talk about the glaring Dow Theory divergence. According to Dow Theory, the different Dow Averages (Industrial, Transportation and - for some - Utility) have to confirm each other’s moves, otherwise a bullish or bearish divergence exists.
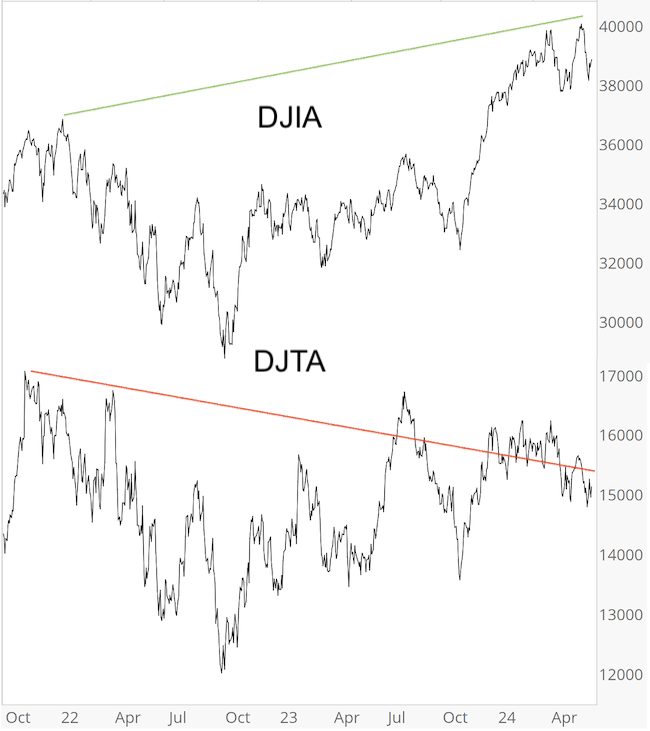
Right now, the Dow Jones Transportation Average (DJTA) is not confirming the Dow Jones Industrial Average (DJIA) all-time highs. In fact, this is one of the longest lasting non-confirmations in history (see chart below).
According to many pundits, this is bad news for stocks. To wit, here are a few recent headlines:
- MarketWatch: Dow transports are trending lower, to send a Dow Theory warning
- CNBC: Dow Theory indicates the march to 40000 could be short-lived
Is the non-confirmation (or divergence) really bearish?
First off, this divergence started on 12/13/2023 when the DJIA closed at a new ATH (37,090). Since then, DJIA easily rallied an additional 7.6%.
Dow Theory is the oldest commonly known market indicator, and the media (and analysts) happily link their opinions to Dow Theory in an effort to gain credibility and capture eyeballs.
For example, on April 18, Morningstar wrote: “This century-old stock-market indicator suggests selloff is far from over.” DJIA bottomed that day and soared aver 5% to new ATHs shortly thereafter.
Over the past 10+ years, I’ve read many Dow Theory doom-and gloom forecasts. Ultimately, none of them came true (at least not for more than a few months).
Subscribers know that I've not been listening the the bearish Dow Theory crowd and dismissed the allegedly bearish implications.
However, in the interest of being objective, I’ve once again reexamined the latest Dow Theory divergence from different viewpoints.
- If we simply identify signals where the DJIA hits a new all-time high while DJTA does not, we get hundreds of signals, and few of them actually turned out to be bearish. However, this approach does not account for the duration of the divergence. Since we are dealing with one of the largest divergences in history, duration should be considered.
- The chart below highlights the biggest divergences since 1999. The vertical black line highlights the DJIA ATH. The green line shows how long the divergence lasted before DJIA peaked. DJIA peaked and sold off at some point and to some extent every time.
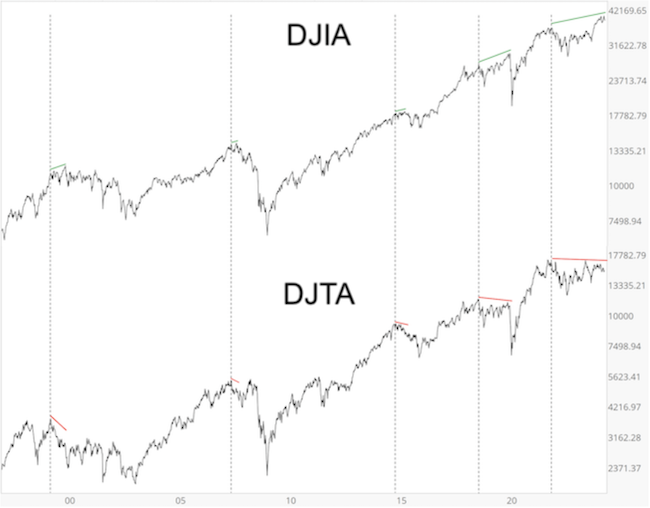
Lessons learned: Obviously, Dow Theory is not a short-term timing tool. Also, divergences can be erased (i.e. by DJTA reaching a new ATH). Few bearish Dow Theory signals have come to fruition, but due to the duration of the current divergence, there may be a reconning ... eventually. I don't think any upcoming decline will be too deep, but it should provide a better entry level for longs.
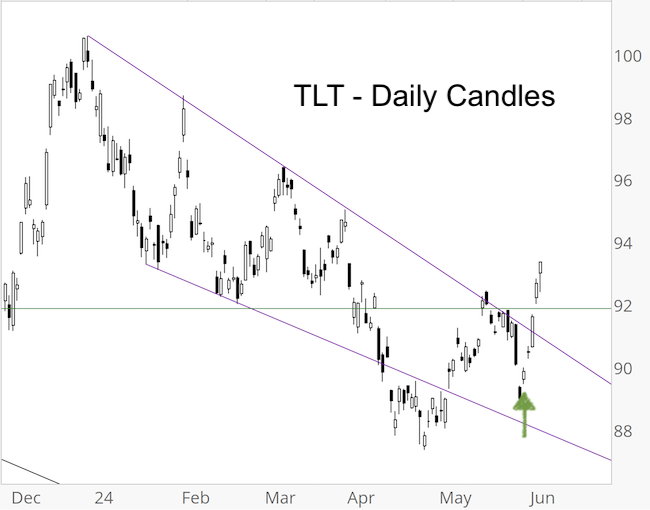
30-year Treasuries (TLT) just broke out of a wedge. The Profit Radar Report recommended buying TLT on May 29 (green arrow). The upper purple wedge line is now support.
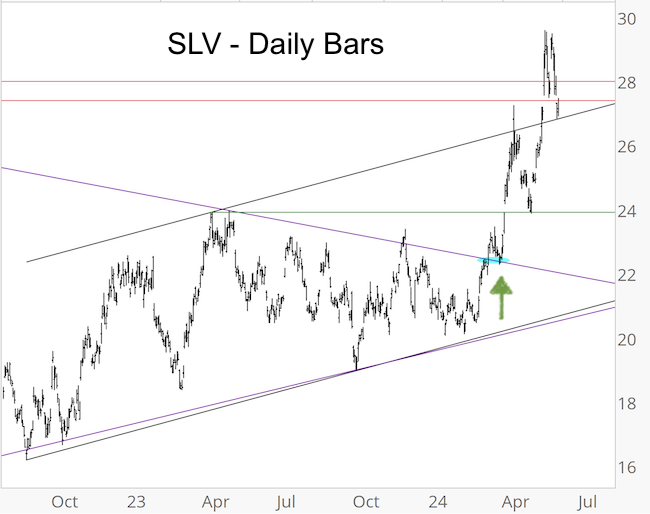
Silver (SLV) broke out of a similar wedge back in March. The Profit Radar Report recommended buying SLV on March 14 at 22.80 (green arrow). The recent volatility has been easier to stomach with some nice gains under our belt.
Wedges are great patterns to trade (they work out more often than not and provide a definite stop-loss level).
A similar - but much bigger wedge - is currently being carved out by another ETF. It's on my watch list and will likely trigger an upcoming Profit Radar Report buy signal soon.
For continued updates and objective, out-of-the box analysis check out the Profit Radar Report.
The Profit Radar Report comes with a 30-day money back guarantee, but fair warning: 90% of users stay on beyond 30 days.
Barron's rates iSPYETF a "trader with a good track record," and Investor's Business Daily writes "Simon says and the market is playing along."
|