Subscribers to iSPYETF’s free e-mail newsletter receive a market outlook, usually once a week. The market outlook below was sent out on May 11, 2023. If you’d like to sign up for the free e-newsletter, you may do so here (we will never share your e-mail with anyone, just as we don't accept advertising).
Wow, it's already been a month since my last free Market Outlook e-mail. So, what's new?
Not much. The market is stuck in a range, which is what we expected as per the 2023 S&P 500 Forecast.
I feel kind of bad for not posting more free updates, but unlike most online outlets that need eyeballs to drive their marketing revenue, I don't just post (or send) catchy stuff for the sake of getting readers' attention. My job is to inform, not to unnecessarily rile up. That's also why iSPYETF is an ad-free zone.
Think about it, how much time have you spent (and wasted?) the last few months reading market analysis and getting your portfolio ready for the 'next big move'?
You didn't waste that time on iSPYETF. When there's no change to my outlook, I don't want to divert your attention from more important or more fun stuff to do (of course subscribers still get updates twice a week, but there hasn't been much new to say either).
The March 3 Market Outlook (What Nobody Wants to Say) reiterated the odds of more sideways churning. Within that churning-mania, the April 2 Profit Radar Report forecast is still playing out:
"It is possible that stocks will suffer a smaller pullback starting next week, recover and grind towards 4,200 - 4,300."
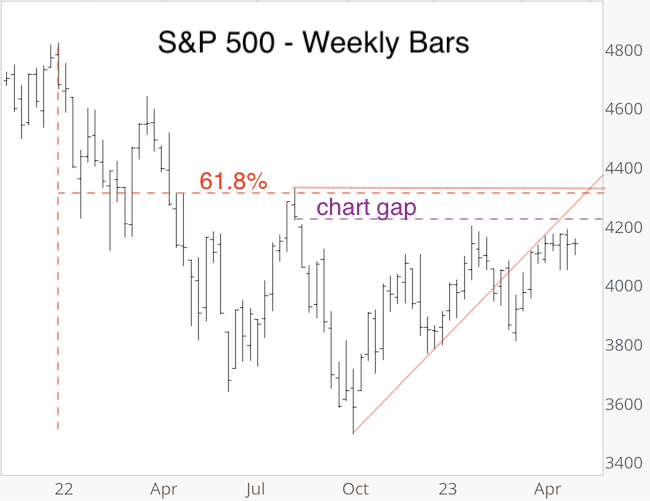
The grind to 4,200 - 4,300 is just that: A grind. Here is why 4,200 - 4,300 is a must watch zone:
- Since 2009, the S&P has closed every single down side chart gap. As mentioned in prior Profit Radar Reports (i.e. August 24, 2022: “Regardless of how much lower the S&P goes immediately, we can almost be certain that the open gap at 4,218.70 will be closed.") we assume that at minimum the chart gap at 4,218.70 (dashed purple line) will be closed before a potentially persistent leg lower. This little-know 'indicator' has been more helpful in navigating the market than any other news development.
- The 61.8% Fibonacci retracement is at 4,311.29. Wave 2 counter trend rallies (bear market rallies) commonly relapse around the 61.8% level.
- There is natural resistance around the August 2022 high at 4,325.28.
The weight of evidence does not favor a major reversal (from up to down) in the 4,218.70 - 4,325.28 zone, but it remains nonetheless an inflection zone that comes with risk of a reversal. In other words, if a reversal is going to occur, it would likely be in that zone.

What About?
But what about narrow leadership? That's been a concern for weeks. At the end of April, the entire YTD S&P 500 gain came from 8 mega cap companies. This isn't the most healthy environment, but it's also not consistently bearish.
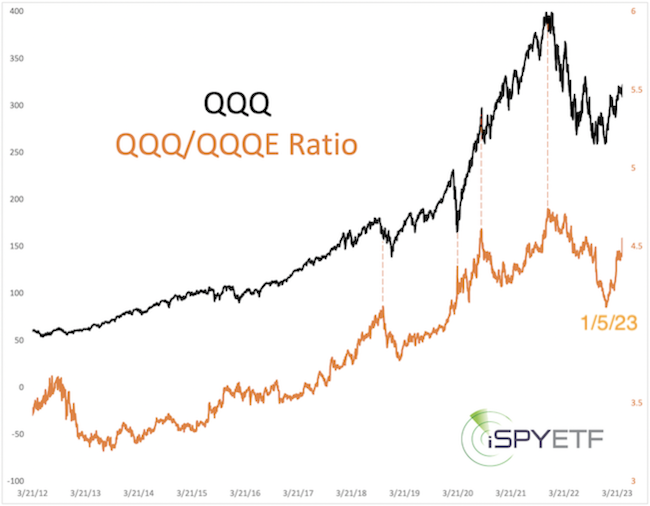
One way to provide context of mega cap outperformance is to compare the cap weighted Nasdaq-100 ETF (QQQ) to the equal weighted Nasdaq-100 ETF (QQQE, data goes back to 2012).
The chart below plots QQQ against the QQQ/QQQE ratio. The ratio soared in 2023 (= mega cap strength). As the dashed lines show, ratio highs coincided with stock market highs in 2020 and 2021, but not every time.
It’s easy to pinpoint a ratio high in hind sight, but we don’t have that luxury in real time and we don’t know if we are at a ratio high or not. While it would be better to see broad market participation, mega cap strength does not have to be an immediate negative for stocks.

But what about the debt ceiling? Invoking the 14th amendment (I don’t comment on the legal or ethical merits of political decisions, just the potential impact on markets) could further deteriorate investors’ faith in the US government and intensify the move from public assets (I.e. government bonds) into private assets (i.e. stocks).
This mega trend continues to be one big reason why I’ve not turned outright bearish, even in 2022.
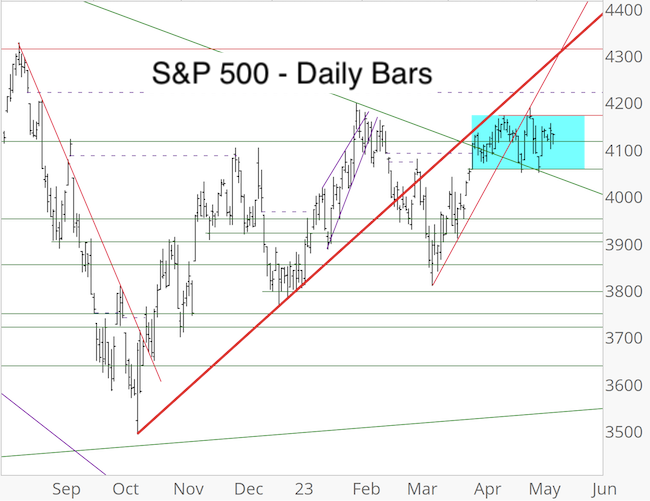
Short-term, nothing is obviously happening while the S&P 500 remains within the blue zone. Even when it finally breaks out (yes, at some point it will), I doubt that the direction of the break will be the next dominant direction.

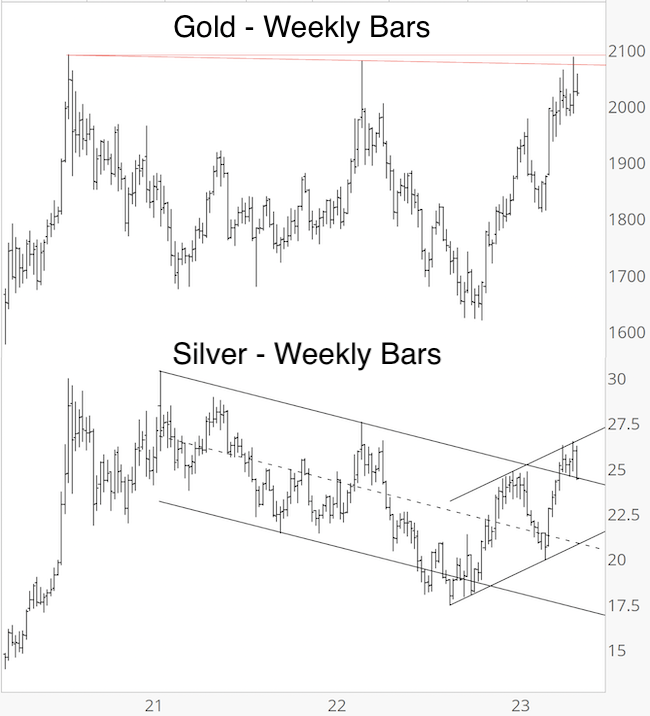
Gold and Silver have been on the verge of a breakout, but as long as the below shown resistance levels remain in place, the breakout is on hold. Notice that silver also dropped back to support today.

For continued updates, purely fact based research, and objective analysis, sign up for the Profit Radar Report.
The Profit Radar Report comes with a 30-day money back guarantee, but fair warning: 90% of users stay on beyond 30 days.
Barron's rates iSPYETF a "trader with a good track record," and Investor's Business Daily writes "Simon says and the market is playing along."
|