Subscribers to iSPYETF’s free e-mail newsletter receive a market outlook, usually once a week. The market outlook below was sent out on March 16, 2023. If you’d like to sign up for the free e-newsletter, you may do so here (we will never share your e-mail with anyone, just as we don't accept advertising).
Three of the biggest US bank failures hit the fan and the popular CNN Fear & Greed Index just fell into 'extreme fear' territory.
But, stocks are up today and U.S. Treasury Secretary Janet Yellen assured congress that the banking system remains sound and Americans can feel confident that their deposits will be there when they need it.
Does that bad news - good news combo mean the crisis is over or that it's time to panic?
We all know that politicians and heads of in trouble companies and institutions never say the full truth. That's one reason why I pay more attention to charts and indicators than the news.
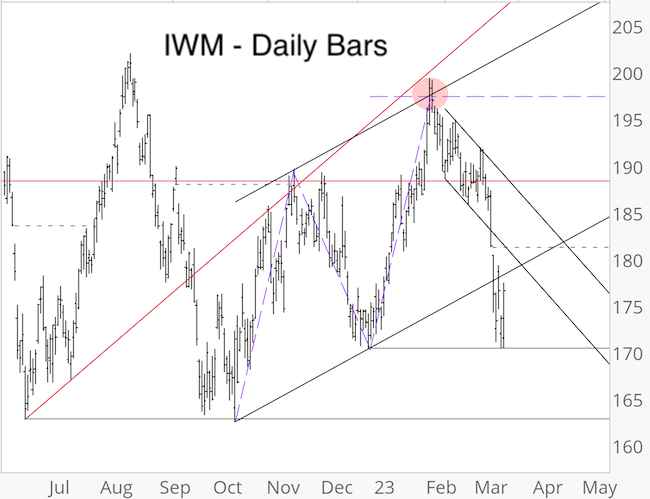
In the February 5 Profit Radar Report, I stated that: "IWM reached resistance mentioned in last Wednesday’s PRR. That resistance is comprised of the trend channel, trend line, and equality between 2 of the 3 legs coming off the October low. A reaction at this level is normal. A number of recent studies suggest stocks will ultimately work their way higher, but IWM did reach an inflection zone that at minimum allows for a deeper pullback."
The updated chart below shows IWM (small cap's) reaction to triple resistance (red circle). Honestly, the pullback from there was deeper than I expected ... but three huge bank failures will do that I guess.

Considering those bank failures, the decline has actually been quite orderly. The worst S&P 500 down days since February were -2.00% (Feb 21) and -1.85% (Mar 9).
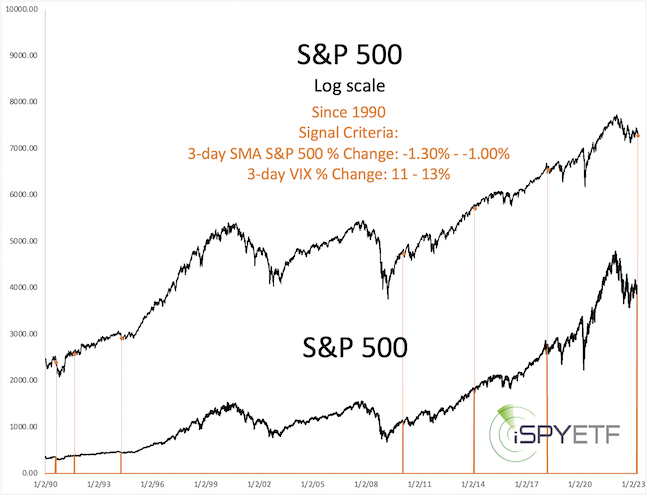
The VIX, however, soared 70% from its March low to high. During the worst 3-day span (Thursday - Monday), the daily average VIX gain was 11.65%, the daily average S&P 500 loss was 'only' 1.15%. Since the inception of the VIX in 1990, something similar has only happened 6 other times.
The chart below highlights when. None of the dates were particularly nefarious.

In addition to this VIX constellation, I also analyzed overall investor sentiment, market breadth, financial and bank sector charts, and the yield curve to ascertain if it's time to panic (this analysis was published in yesterday's Profit Radar Report).
Although I follow the weight of evidence of trusted and time tested indicators, I always monitor new developments and re-run scenarios (such as in yesterday's 'deep dive' update) to see if my base line forecast is still supported by the weight of evidence or needs an adjustment.
My baseline, shared in the last Free Market Outlook, remains the same: Although I don't know how deep this correction will go, I am fairly certain that stocks will come back later this year. The extent and duration of the comeback will be assessed as it develops.
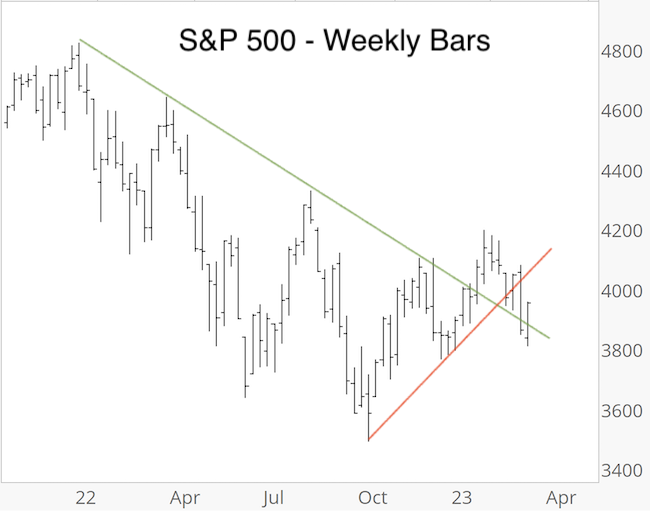
However, I am never foolish enough to think I'll be right. The weekly S&P 500 chart shows that the S&P 500 is still in limbo. Now back above the green trend line, but still below the red line ... and all of this is happen in a year-long trading range.
If price falls back below the green trend line, it's time to be cautious and allow the down side to develop.

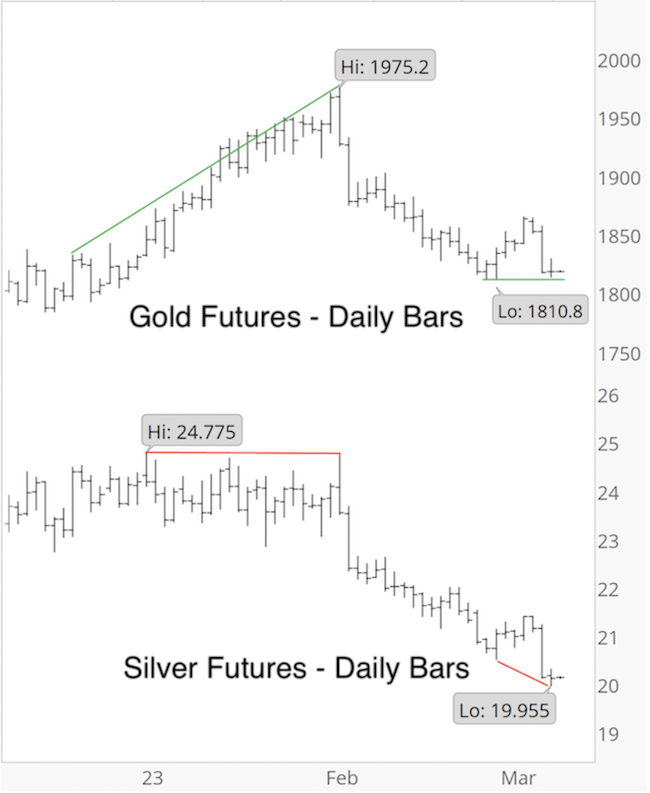
Regarding gold, I stated the following in the March 8 Profit Radar Report (along with the chart below):
"Prior to gold's (and silver's) February drop, the negative divergence alerted us of lower prices. We now see a potential positive divergence."

The next day gold started to soar over $100.
If you are considering subscribing to the Profit Radar Report, you may be interested to know that I adhere to what I call intelligent integrity; analyze trusted indicators and interpret them intelligently without bias.
For continued updates and based purely fact based research, sign up for the Profit Radar Report.
The Profit Radar Report comes with a 30-day money back guarantee, but fair warning: 90% of users stay on beyond 30 days.
Barron's rates iSPYETF a "trader with a good track record," and Investor's Business Daily writes "Simon says and the market is playing along."
Subscribers to iSPYETF’s free e-mail newsletter receive a market outlook, usually once a week. The market outlook below was sent out on January 28. If you’d like to sign up for the free e-newsletter, you may do so here (we will never share your e-mail with anyone, just as we don't accept advertising).
Continued updates and factual out-of-the box analysis are available via the Profit Radar Report.
The Profit Radar Report comes with a 30-day money back guarantee, but fair warning: 90% of users stay on beyond 30 days.
Barron's rates iSPYETF a "trader with a good track record," and Investor's Business Daily writes "Simon says and the market is playing along."
|