Subscribers to iSPYETF’s free e-mail newsletter receive a market outlook, usually once a week. The market outlook below was sent out on November 3, 2022. If you’d like to sign up for the free e-newsletter, you may do so here (we will never share your e-mail with anyone, just as we don't accept advertising).
The Dow Jones Industrial Average (DJIA) has been on a tear, gaining 15.38% from October low to high, outperforming all major indexes.
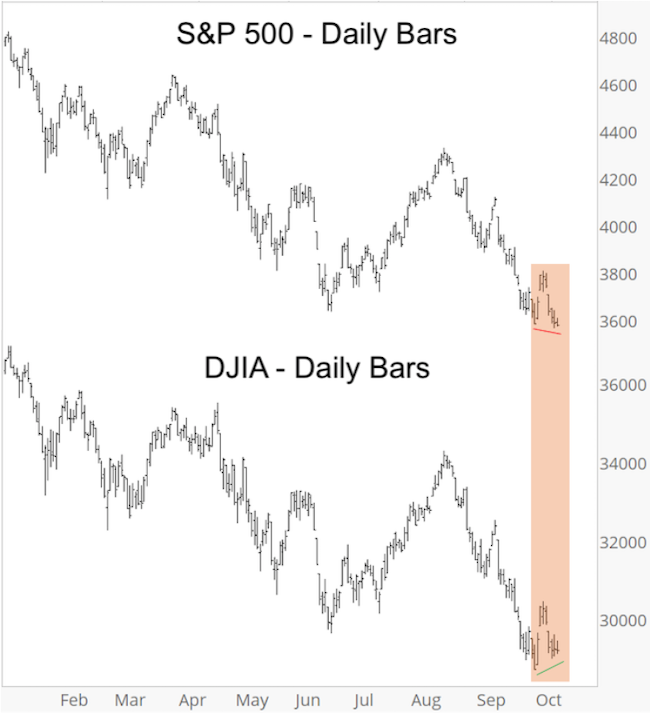
This DJIA pop came seemingly out of nowhere, and yet it didn't. Via the October 12 Profit Radar Report (one day before DJIA started taking off), I shared a bullish divergence and stated that: "For the first time since the January highs, DJIA is diverging from the S&P 500 at the low."
The chart below, published on October 12, shows the divergence.

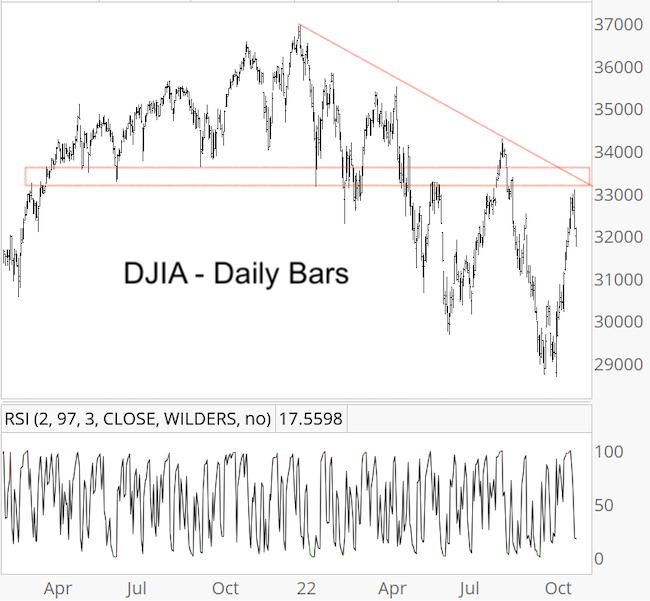
This spirited DJIA rally carried price towards major resistance outlined below.

I published a chart very similar to the above in the October 30 Profit Radar Report along with the following commentary:
"RSI-2 is over-bought and the trajectory of the advance is obviously not sustainable. Major resistance is coming into play around 33,200. Now is not the time to chase DJIA."
The pullback from resistance was pretty obvious, the big question is what happens next.
Since 1970, DJIA rallied more than 12% in a span of 13 trading days only 32 other times. Looking at those times, which of course I did (see November 2, Profit Radar Report), provides some helpful clues.
There is also a huge mega trend affecting blue chip stocks in play. I plan to share this trend even via the free newsletter soon.
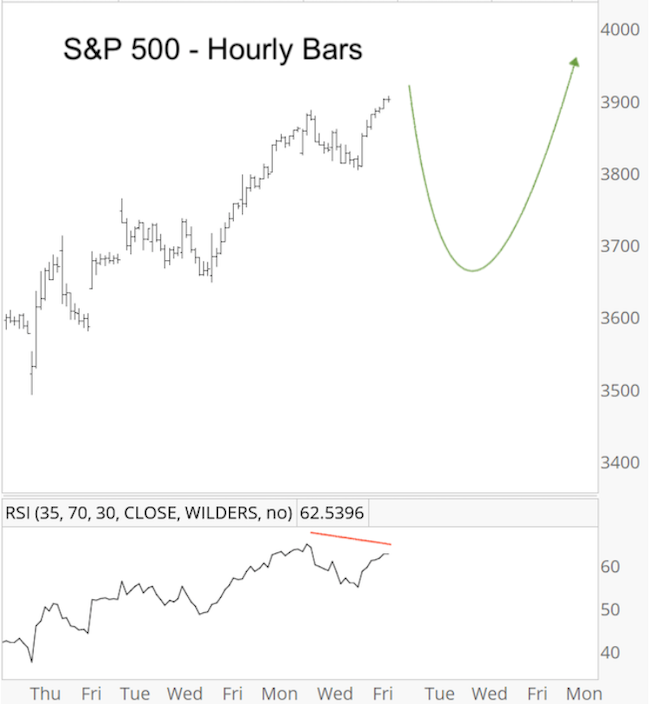
While the benefits of the above DJIA study are long-term in nature, below is the expected short-term S&P 500 trajectory (published in the October 30, Profit Radar Report).

The S&P 500 appears to have completed an up side pattern in the 3,900 zone, which should cause a corrective pullback (now underway).
Based on seasonality and some other factors, the pullback should be corrective, but the S&P pattern (and major DJIA resistance) allows for a more bearish turning point as well.
Although I'm leaning towards more gains once the pullback is over, I'm watching this decline very carefully for red flags that'd suggest otherwise.
Continuous updates are available via the Profit Radar Report. If you want to be the best-informed investor you know, and have access to always relevant and purely fact-based research, sign up for the Profit Radar Report.
The Profit Radar Report comes with a 30-day money back guarantee, but fair warning: 90% of users stay on beyond 30 days.
Barron's rates iSPYETF a "trader with a good track record," and Investor's Business Daily writes "Simon says and the market is playing along."
Subscribers to iSPYETF’s free e-mail newsletter receive a market outlook, usually once a week. The market outlook below was sent out on January 28. If you’d like to sign up for the free e-newsletter, you may do so here (we will never share your e-mail with anyone, just as we don't accept advertising).
Continued updates and factual out-of-the box analysis are available via the Profit Radar Report.
The Profit Radar Report comes with a 30-day money back guarantee, but fair warning: 90% of users stay on beyond 30 days.
Barron's rates iSPYETF a "trader with a good track record," and Investor's Business Daily writes "Simon says and the market is playing along."
|