Subscribers to iSPYETF’s free e-mail newsletter receive a market outlook, usually once a week. The market outlook below was sent out on March 17. If you’d like to sign up for the free e-newsletter, you may do so here (we will never share your e-mail with anyone, just as we don't accept advertising).
It became clear last week that the S&P 500's 50-day SMA was about to fall below the 200-day SMA, it's called a 'death cross' (I didn't come up with that), and the media makes a big deal about it. Here are some headlines from Monday (when the death cross happened):
- Bloomberg: Watch S&P 500 falls into 'death cross'
- MarketWatch: Death cross crystalizes ... in a bearish sign for the stock market
- Yahoo Finance: Investors now expect a bear market in 2022
I didn't even mention the death cross. Why? Unlike catchy headlines, the facts show that the ominous label is downright misleading.
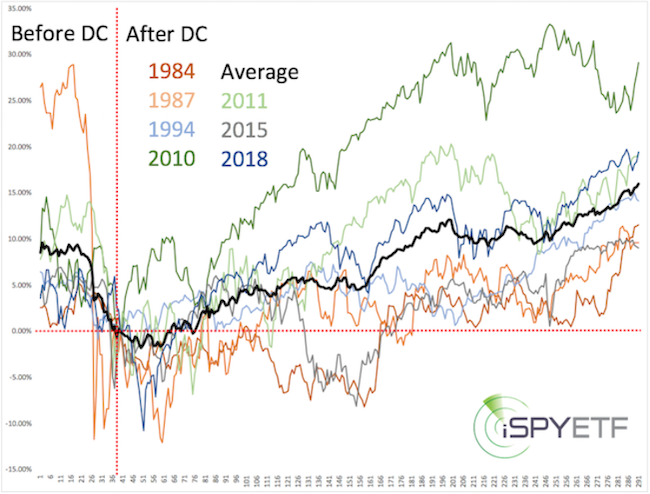
Since 1970, the death cross + (with filter) triggered 8 other times. The added filter requires for the signal to be the first in at least 10 month, and to happen after a minimum loss of 3% over the previous 4 weeks.
The chart below shows the trajectory 40 days prior to the signal (dashed red line) and the performance after the signal.

The astute reader will notice that only 7 signals are shown. Why?
Because this chart was original published in the March 30, 2020 Profit Radar Report. The death cross discussed at the time triggered on March 27, 2020, when the S&P 500 closed at 2,541.47.
The March 27, 2020 death cross triggered an avalanche of bearish headlines, but this timely study unmistakable showed that the death cross is not bearish, but quite the opposite.
Now you know why the Profit Radar Report relies only on facts, not popular opinion (and why the Profit Radar Report has one of the highest renewal rates in the business).
Of course, the so called death cross was in conflict with our assessment. Last week's free Market Outlook stated that:
"The S&P 500 is getting closer to a potential bounce in terms of timing. I would still like to see one more nasty washout day that meets certain requirements to pull the trigger."
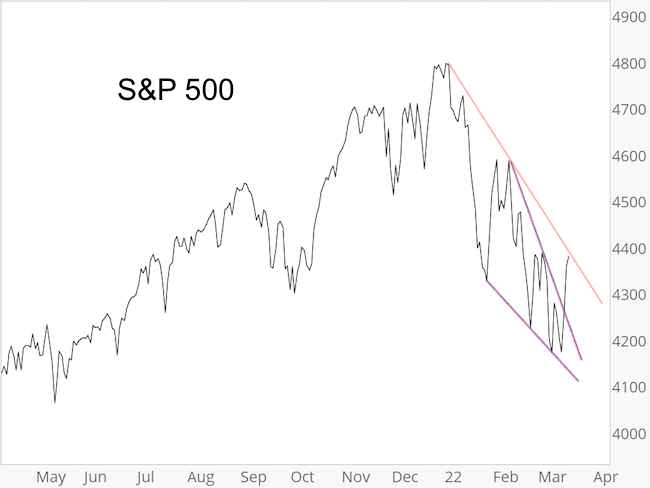
We did not get that nasty washout day (Monday's drop didn't meet my requirements), but the S&P 500 appears to have completed a the purple contracting diagonal shown last week ... and the S&P has soared more than 200 points since the death cross.

Resistance is nearby, but as long as diagonal support holds, we are looking for higher prices. Gains don't have to be explosive, but further up side seems more likely than a breakdown (triangle support can be used as point of ruin).
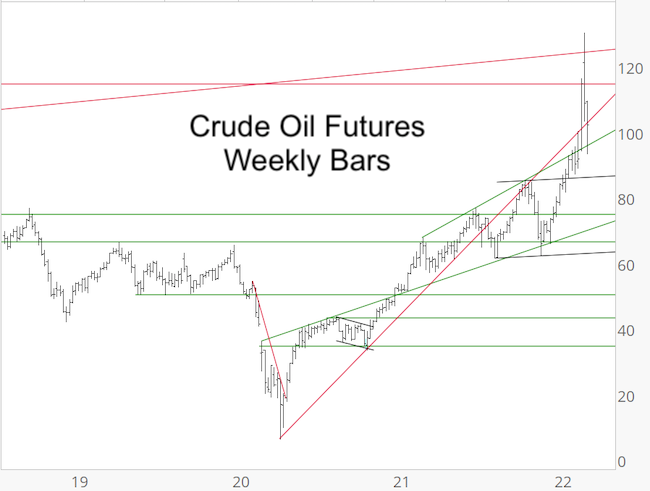
Crude oil: The March 2 PRR warned that: "RSI-2 is over-bought and resistance created by the May 2011 highs is nearby. This is not the time to chase oil."

Oil fell as much as 28.42% from its high, but found support around 95. More important support is around 86.
There are so many unprecedented variables right now, but that's what people said during the March 2020 drop and pop.
Fact-and-data-based analysis worked during the unprecedented pandemic and has the best odds of working again today.
Defeat analysis paralysis, get an edge on the crowd, and invest based on facts not tales. Sign up for the Profit Radar Report.
The Profit Radar Report comes with a 30-day money back guarantee, but fair warning: 90% of users stay on beyond 30 days.
Barron's rates iSPYETF a "trader with a good track record," and Investor's Business Daily writes "Simon says and the market is playing along."
|