The S&P rallied a decadent 5% in January and 2013 has been smooth sailing for stocks thus far.
The Federal Reserve probably deserves a fair share of credit for keeping the stock market humming.
Considering QE’s effect on the liquidity pool, it might be beneficial to look at stocks’ seasonal performance since the onset of ‘modern QE.’
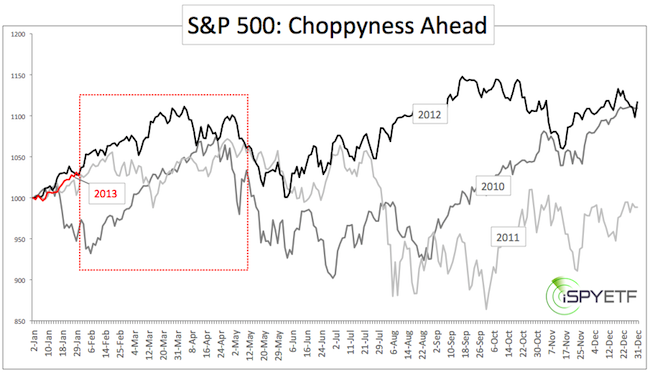
The chart below compares the 2010, 2011, 2012 annual S&P 500 performances (2013 in red).

2011 and 2012 started out quite similar to 2013. In 2011, the S&P rallied until February 18 before correcting and turning choppy. In 2012 the S&P rallied until March 27, but a couple of 3-4% corrections introduced some choppiness already in late January. 2010 saw a mean 7% selloff materialize already on January 19.
A look at longer-term seasonality (going back to 1950) shows weak February performance in overall S&P 500 seasonality, post-election year seasonality, and post-election year seasonality with a democratic president.
CBOE Volatility Index or VIX seasonality shows a minor VIX low early in February (detailed seasonality charts for the S&P 500 and VIX are available to Profit Radar Report subscribers).
Sentiment (Article: How Worrisome is Bullish Sentiment?) suggests that a cooling period is approaching.
In short, February is quite likely to bring lower prices for U.S equities. Depending on your investment strategy and future outlook, this is either an opportunity to unload stocks before prices drop or pick up stocks at a lower price tag later on.
|