Subscribers to iSPYETF’s free e-mail newsletter receive a market outlook, usually once a week. The market outlook below was sent out on January 13, 2022. If you’d like to sign up for the free e-newsletter, you may do so here (we will never share your e-mail with anyone, just as we don't accept advertising).
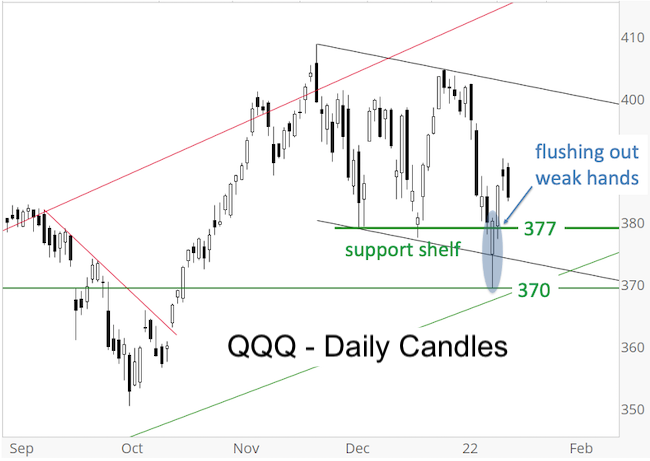
This week started with a bang; Nasdaq-100 and QQQ tumbled as much as 3% on Monday ... but turned around and quickly erased those losses. This 'flushing out of weak hands' was exactly what I wrote about the day before in Sunday's Profit Radar Report:
"The QQQ support shelf around 378 may be obvious enough to require a brief drop to about 375 to flush out weak hands with stop-losses just below 377. In terms of risk management, a move below 377 would be a warning while it lasts and allow for a drop to about 370. Knowing that such a move (to 370) may only be temporary, a move back above 379 - 383 would be an indication of more gains to come."
As the chart below shows, weak hands (unconvinced bulls with stop-loss just below support at 377) have certainly been flushed out by Monday's swiftly retraced drop.
Will the remaining 'strong hands' (or longs) be rewarded?

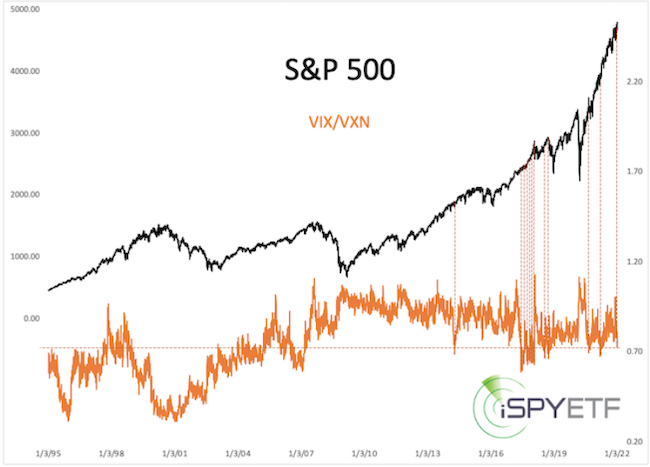
Elevated Nasdaq volatility, as measured by VXN (VXN is like the VIX for Nasdaq-100), has been a concern for many. VXN has been high when compared to the VIX (volatility for S&P 500). The chart below plots the S&P 500 against the VIX/VXN ratio (low ratio means Nasdaq-100 volatility is higher than S&P 500 volatility).

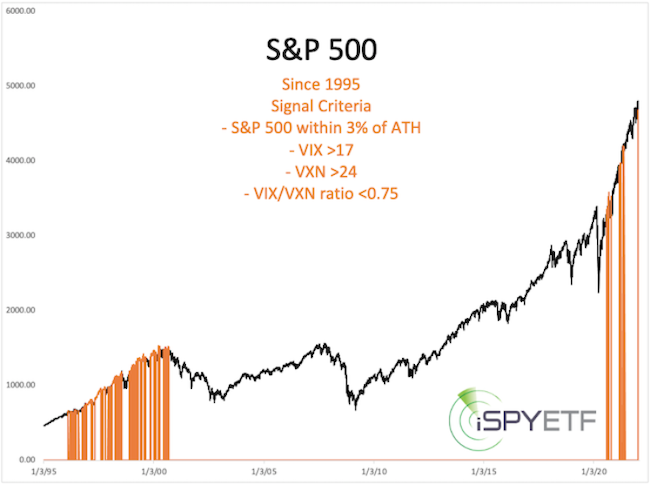
A low VIX/VXN ratio was common in the early 2000s but appeared less frequent in recent years. If we add a couple more requirements (see chart insert) we see that this condition only existed during two periods: 1995 - 2000 and 2020 - today.
The piper was paid eventually, but there were a lot of false 'the top is in' alarms before the actual top arrived.

As far as the S&P 500 is concerned, our trusty support line held again on Monday.
In fact, the S&P 500 may be carving out a somewhat rare but rather predictive pattern (thus far it's checking all the boxes). This pattern provides a must hold support level, an up side target, and what will happen once the target is reached. I'll certainly keep an eye on it.

Continued updates, out-of-the box analysis, forward performance based on historic precedents (Risk/Reward Heat Map) and the 2022 S&P 500 Forecast are available via the Profit Radar Report.
The Profit Radar Report comes with a 30-day money back guarantee, but fair warning: 90% of users stay on beyond 30 days.
Barron's rates iSPYETF a "trader with a good track record," and Investor's Business Daily writes "Simon says and the market is playing along."
|