Subscribers to iSPYETF’s free e-mail newsletter receive a market outlook, usually once a week. The market outlook below was sent out on December 8, 2021. If you’d like to sign up for the free e-newsletter, you may do so here (we will never share your e-mail with anyone, just as we don't accept advertising).
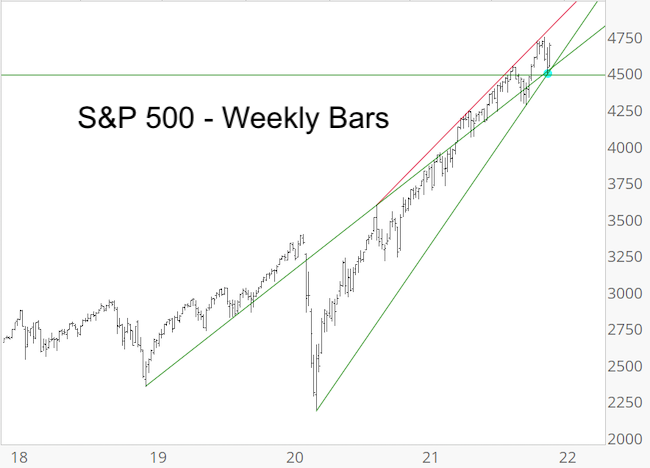
Last week's free Market Outlook featured this S&P 500 chart with focus on support around 4,500. The S&P dipped as low as 4,494 on Dec. 3 and is up some 200 points since.

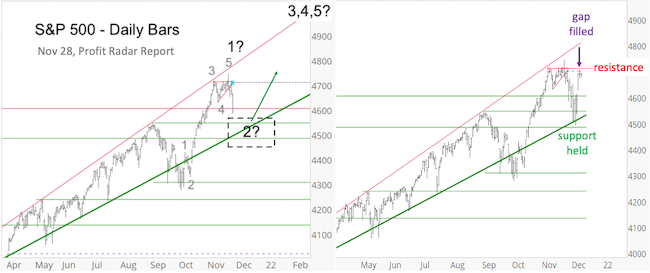
4,500+/- is important because it was also the approximate mid-point of two Fibonacci support levels (4,566 and 4,456). Those two levels were used to draw the dashed target box for a wave 2 pullback (left side, chart below).
The left chart was originally published in the November 28 Profit Radar Report. It projected a wave 2 correction into the 4,566 - 4,456 target range followed by a rally to complete waves 3, 4, 5.
The right side also includes price action since Nov. 28.

One important reason I favored at the very minimum a bounce back from support around 4,500 was the open chart gap at 4,701. Gaps act as magnets for prices, and this gap was closed yesterday (corresponding gaps for IWM and MDY remain open).
Short-term, there is solid resistance around 4,700. This is a hurdle, but I think that it will be overcome eventually too.
During the midst of the selloff, I shared this assessment via the Profit Radar Report:
"Based on the weight of evidence, the bullish case deserves the benefit of the doubt. This is a bold preposition, but - based on the VIX - there was enough blood on the street to offer at least a short-term buying opportunity for aggressive traders."
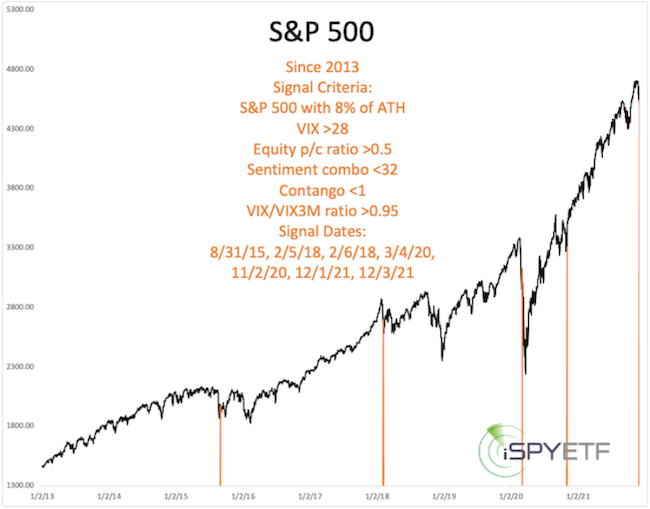
Sentiment readings registered at last week's low confirmed this assessment. Highlighted below are other times when 5 different sentiment gauges were at nearly identical levels (see chart insert for actual sentiment indicators and criteria) while the S&P 500 was still within 8% of an all-time high.

The S&P obviously tumbled in March 2020, but it did so without any strong up day (like last Thursday) in between. The other 3 signal clusters led at the very minimum to decent bounces.
To sum up, the S&P 500 bounced from highlighted support and closed the open chart gap at 4,701, which was my minimum target. Resistance around 4,700 may pause the advance, but I think will eventually be exceeded too (at least for a while :).
As you know, I study many historic patterns, and one recent one absolutely stood out. This pattern, seen during the last couple weeks, occurred 8 other times since 1970 and and was followed by the same outcome every time.
Not only was the outcome consistently the same, it was also in the double digits. It is incredibly rare to find such a persuasive pattern.
The exact pattern, whether bullish or bearish, and when it happened before is featured in last night's Profit Radar Report. Don't invest blindly, get the radar.
Continued updates, out-of-the box analysis and forward performance based on historic precedents (Risk/Reward Heat Map) are available via the Profit Radar Report.
The Profit Radar Report comes with a 30-day money back guarantee, but fair warning: 90% of users stay on beyond 30 days.
Barron's rates iSPYETF a "trader with a good track record," and Investor's Business Daily writes "Simon says and the market is playing along."
|