Subscribers to iSPYETF’s free e-mail newsletter receive a market outlook, usually once a week. The market outlook below was sent out on September 23. If you’d like to sign up for the free e-newsletter, you may do so here (we will never share your e-mail with anyone, just as we don't accept advertising).
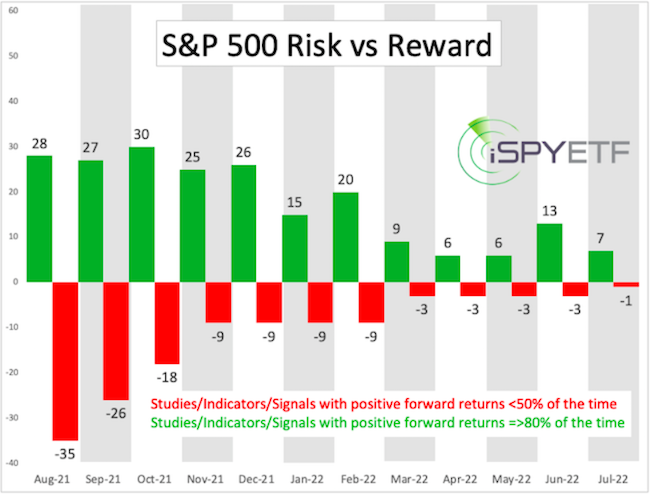
The Risk/Reward Heat Map (RRHM), featured in the September 6 Profit Radar Report (and re-posted below), showed an elevated risk level for September, and we saw the biggest pullback in over a year (5.28% peak to trough for the S&P 500).

Monday's decline, the biggest one-day drop since May 12, moved a couple of big forecasting services to call this bull market 'confirmed over.'
While the risk was 'on schedule,' I didn't - I couldn't - call the bull market over or even presume further losses. Here were my three reasons for giving bulls the benefit of the doubt:
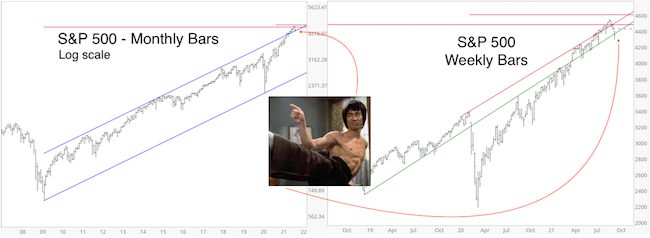
- The S&P 500 still closed above key long-term support levels
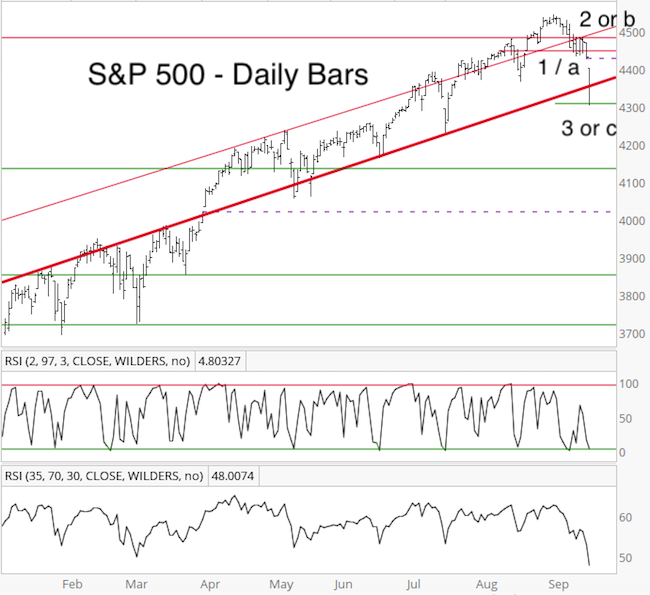
- The decline unfolded in only 3 waves (wave 3 tagged Fibonacci target at 4,308).
- Stocks left a massive open chart gap
In Monday's special Profit Radar Report update I stated the following:
"The S&P 500 decline is best counted as 3 waves. There is a massive open chart gap at 4,427.78 which is highly likely to be closed. The S&P 500 closed above various support levels and is likely to bounce from here."
The charts below show two long-term S&P 500 support or 'ditch levels' (as in: don't ditch stocks until support is broken).

The next chart shows the 3-wave decline (this is the original chart published in Monday's Profit Radar Report) and open chart gap (dashed purple line). Also notice that wave 3 tagged the 1.618 Fibonacci extension level (of wave a green line) at 3,308 and that RSI-2 was over-sold.

As of this morning, the gap has been closed and price already overlapped the wave a low (4,435.36), which means a straight-forward, bearish 5-wave decline is no longer possible.
According to Elliott Wave Theory, a 5-wave decline would have indicated a trend change from up to down, while a 3-wave decline is only a counter trend correction.
To be honest, on Monday I thought there's at least a 50% chance the 3-wave decline in place at the time would tag on waves 4 and 5 and turn into a more bearish 5-wave decline.
A number of analysts projected just that and already called the bull market over, but such conviction without evidence is just wishful thinking. My analysis is certainly not perfect, but I don't allow it to be clouded by personal expectations.
Based on Elliott Wave Theory, the decline is likely over unless it turns into a more rare and exotic pattern indicative of a trend change.
Simply based on resistance, stocks still could be rebuffed and I mentioned in Sunday's Profit Radar Report that:
"Bearish September seasonality seems to have gotten a fair amount of media attention. The market may decide to bounce and flush out premature bears." I suppose the bounce is accomplishing just that.
Continued updates, out-of-the box analysis and forward performance based on historic precedents are available via the Profit Radar Report.
|