Subscribers to iSPYETF’s free e-mail newsletter receive a market outlook, usually once a week. The market outlook below was sent out on August 5. If you’d like to sign up for the free e-newsletter, you may do so here (we will never share your e-mail with anyone, just as we don't accept advertising).
Please accept my apologies for the lengthy newsletter pause. My brother and I had to go to Germany to take care of some property-related issues.
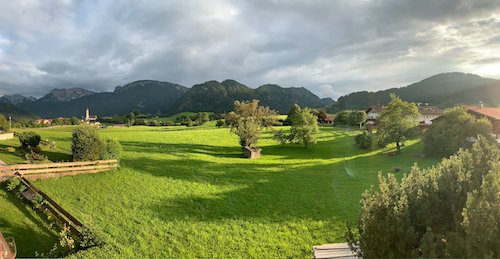
Thank you for the concern many have shown about the devastating floods. Fortunately those occurred north of where we were, but we feel for many who have lost their homes and lives. This is the view from our balcony after it stopped raining.

I always work remotely and have never skipped a scheduled Profit Radar Report update, but since I didn't expect any big moves (and nothing changed) there was no absolute need for Market Outlook updates. I hope you are enjoying a good summer (up until today uninterrupted by my e-mails :).
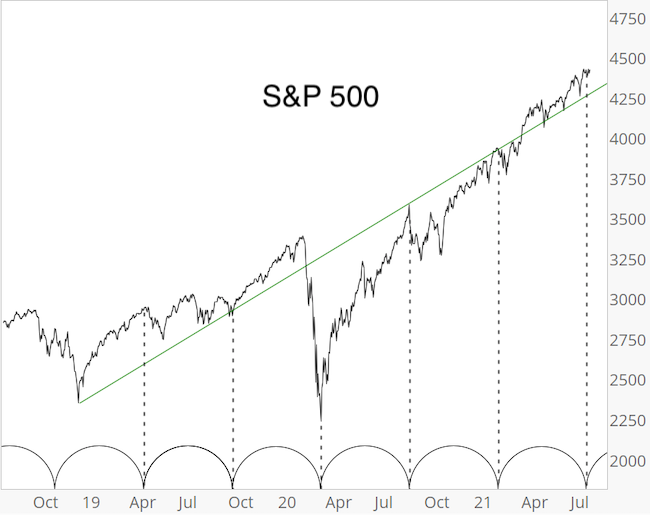
From a timing perspective, the S&P 500 encountered an interesting 114-day turning cycle that's been working since 4/26/2019. Thus far, the cycles has not been validated nor has it been invalidated, but if the cycle is going to show its teeth it should do so soon.

Two developments I always monitor, especially with the S&P 500 at or near all-time highs, are breadth and sentiment.
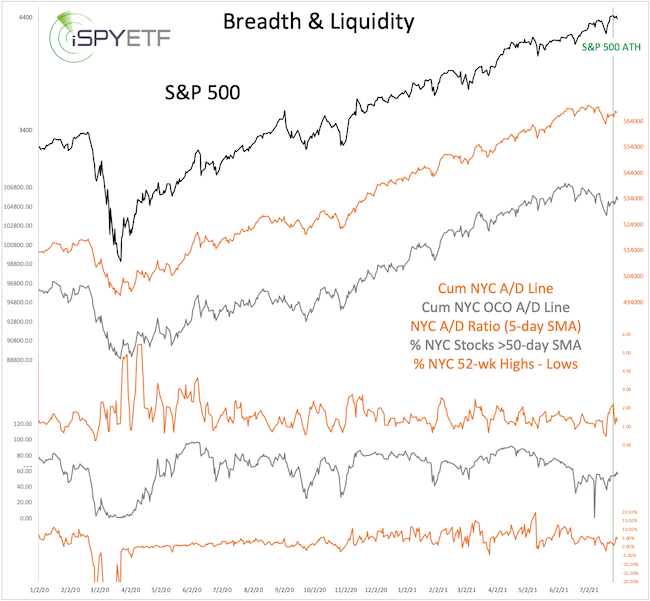
The chart below plots the S&P 500 against a variety of breadth gauges, all of which have failed to confirm the latest S&P highs. The bearish divergence between the S&P and the cumulative NY Composite advance/decline lines are considered highly bearish by many analysts.

While the 1987, 2000 and 2007 market tops were preceded by S&P 500 / NYC a/d line divergences, not every divergence causes a major top.
The Profit Radar Report looks at the big picture and now consistently identifies how the market reacted in the past to conditions we see today.
For example, in addition to the bearish divergence, at the July 26 all-time high:
- only 43.62% of volume flowed into advancing stocks
- only 45.75% of NYSE stocks advanced
- NYSE highs outpaced lows by only 1.85%
- 56.31% of stocks traded above their 50-day SMA
- 87.98% of stocks traded above their 200-day SMA
The first 3 data points are based on 10-day SMAs to smooth out outliers. Aside from the 200-day SMA figure, that's some seriously 'bad breadth.'
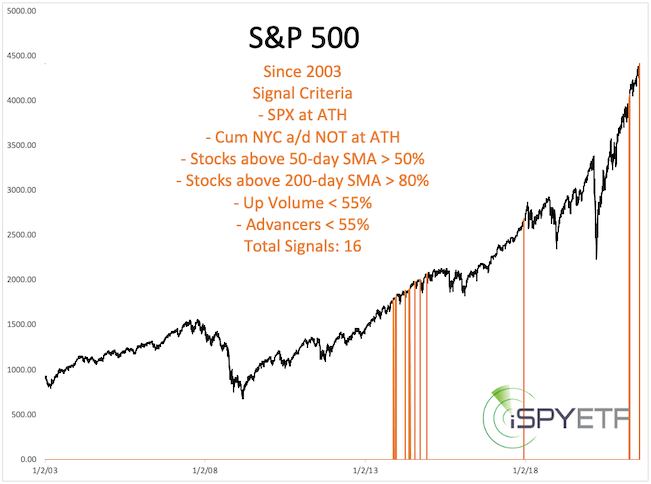
One could (and many do it every day) cherry pick one of the above indicators, look at past precedents, and paint a bearish picture (the percentage of stocks above their 50-day SMA is particularly ominous). But, and that's a big but, if you you look at all of the above indicators, you get the signal dates below.

Unfortunately those signals dates are neither bullish nor bearish and are not very actionable, so what's the point?
This knowledge protects us against falling prey to biased, ignorant or fear-mongering analysis.
The latest Sentiment Picture features the same kind of analysis for investor sentiment and shows at what other times the 9 sentiment gauges we monitor stood at levels most similar to today.
In short, based on cycles we are watching if there's enough weakness to draw the S&P 500 below important support. As long as there isn't, stocks can continue to grind higher.
Continued updates, out-of-the box analysis and forward performance based on historic precedents are available via the Profit Radar Report.
The Profit Radar Report comes with a 30-day money back guarantee, but fair warning: 90% of users stay on beyond 30 days.
Barron's rates iSPYETF a "trader with a good track record," and Investor's Business Daily writes "Simon says and the market is playing along."
|