Subscribers to iSPYETF’s free e-mail newsletter receive a market outlook, usually once a week. The market outlook below was sent out on March 11, 2021. If you’d like to sign up for the free e-newsletter, you may do so here (we will never share your e-mail with anyone, just as we don't accept advertising).
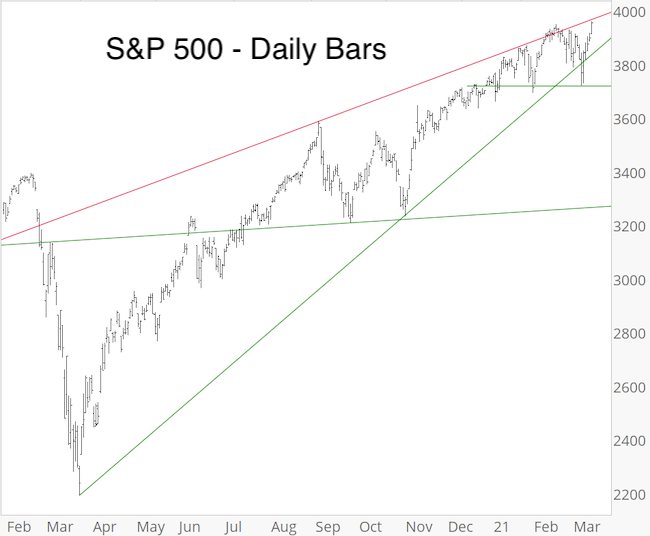
Last week around this time the S&P 500 fell below the trend line from the March low for the first time. This opened the door for a more pronounced decline, but only as long as price remained below that trend line.

As last week's Market Outlook stated: "This trend line has now turned from support into resistance and downside risk should be respected as long as resistance holds or support is recognized."
Last Wednesday's Profit Radar Report highlighted the distinct possibility of a seesaw across this trend line when it stated that:
"S&P 500 Futures are back at trend line support again which will conjoin the 50-day SMA in the next couple of days. Due to the multiple touchpoints the trend line from the March low has already become more visible and soon it will coincide with the widely watched 50-day SMA. When a support level becomes too obvious it is more likely to be subject to seesaw."
As of yesterday, the Nasdaq-100 was down 7.4% while the Dow Jones was at an all-time high. The last time this happened was in May 2001.
The Nasdaq-100 recognized the support shown in last week's Market Outlook and bounced, up another 2.70% today.
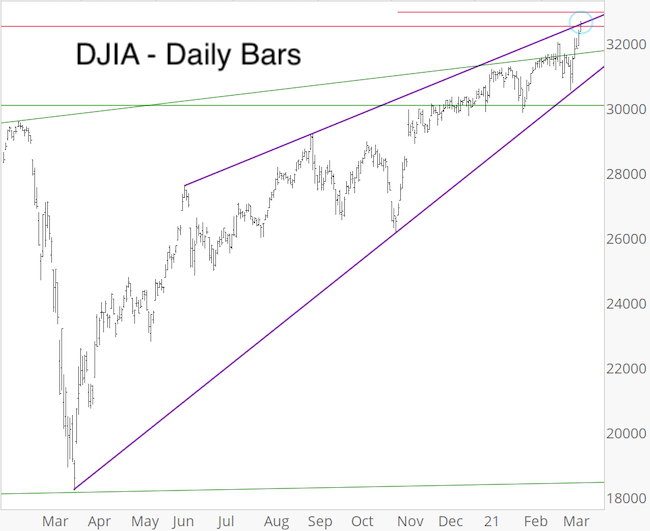
Purely based on its chart, the Dow Jones has the most bearish potential ... and for now that's all it is, potential. The purple lines outline a wedge (or diagonal) formation. Other indexes showed similar patterns months ago buy invalidated them, so I consider the odds of the DJIA wedge playing out reduced.

Wedges often conclude with a throw-over, which is currently in place. A close back below the upper wedge line and then the lower wedge line would be first confirmation of post-wedge performance (which has significant bearish potential). The trend, however, is up as long as price remains above the upper purple line.
The Biggest Lie on Wall Street
10-year Treasury yields are up almost 200% over the past year. As the headlines below show, rising yields have become the scape goat for recent stock market weakness:
-
Rising rates are hurting stocks. The threat isn't going away - Barron's
-
Surging US Treasury yields threaten stock market rally - S&P Global
-
The stock market is falling because Treasury yields won't stop rising - Barron's
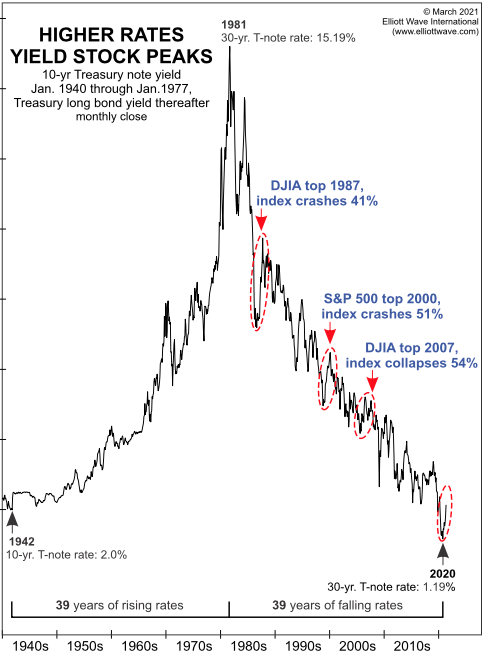
One market forecasting service, that uses any excuse to predict a stock market collapse, published the chart below, essentially implying a 40-50% collapse.

Headlines and charts like the above are misleading investors and spreading the biggest lie on Wall Street right now.
I'm the first to admit that I don't get every call right, but I never spread misleading or biased information.
I just published a special report that identifies periods of rising yields along with the most extreme historic yields spikes and how the S&P 500 performed during or after those times (the special report is available for free to subscribers). This report shows that the problem for stocks is not rising yields but something far different.
Investing is tough enough and the only way to make educated decision is to know the facts and be the best-informed investor you know.
Continued updates and factual out-of-the box analysis are available via the Profit Radar Report.
The Profit Radar Report comes with a 30-day money back guarantee, but fair warning: 90% of users stay on beyond 30 days.
Barron's rates iSPYETF a "trader with a good track record," and Investor's Business Daily writes "Simon says and the market is playing along."
|