Subscribers to iSPYETF’s free e-mail newsletter receive a market outlook, usually once a week. The market outlook below was sent out on December 17. If you’d like to sign up for the free e-newsletter, you may do so here (we will never share your e-mail with anyone, just as we don't accept advertising).
Two weeks ago we discussed the tug-of-war between red hot sentiment and strong breadth and concluded the following:
"Normally the combination of historic investor optimism while stocks are pressing against long-term resistance is a recipe for disaster. But, as the above studies show, strong stock market internals are likely to over-power other risk factors."
Strong breadth continued to push stocks higher with all the major indexes trading above the resistance levels mentioned two weeks ago. Those resistance levels have now become support. As long as support holds stocks can grind higher.
Interestingly, although all major indexes are at all-time highs, the biggest mega cap stocks (AAPL, AMZN, FB, MSFT) are carving out triangles as shown here on Twitter.
The November 15 Profit Radar Report stated that: "A number of studies suggest that small cap stocks may have entered a period of out performance."
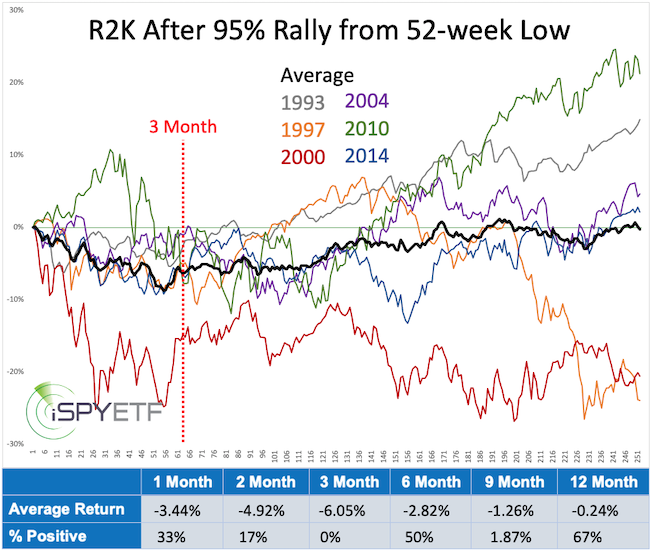
Since the March low, the Russell 2000 has almost doubled. Since 1987, the Russell 2000 rallied more than 95% from a 52-week low 6 other times. On average, it took the R2K more than 2 years to accomplish this feat, but only 9 month in 2020.
Regardless, the chart below shows how the Russell 2000 performed after it rallied 95% from a 52-week low. At some point over the next 3 month the R2K was down every time (performance for the S&P 500 was not nearly as bad).

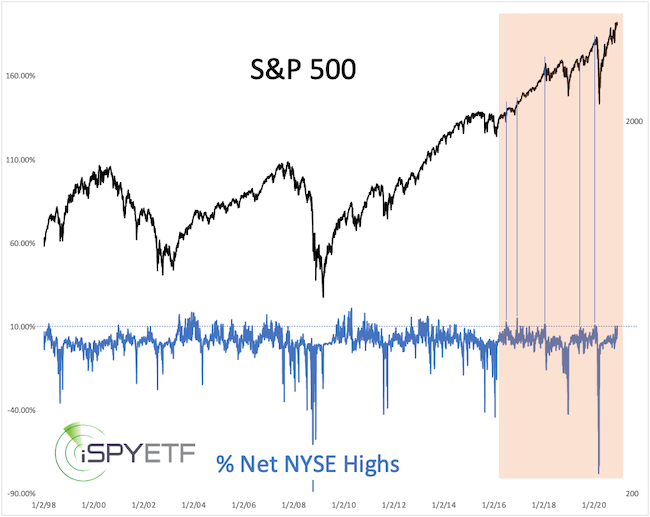
On 11/9/20 and 12/9/20, the amount of net new 52-week NYSE highs exceeded 10% (net = new highs - new lows). As the orange box shows, readings above 10% have been rare since 2016.
Since 2016, there were 6 clusters of above 10% readings (blue lines).The average forward performance was positive but muted (exact forward performance study was published in the December 16 Profit Radar Report).

In summary, the epic tug-of-war continues (there truly have never been such simultaneous sentiment and breadth extremes). As long as price stays above support, bullish breadth forces will likely trump bearish sentiment forces.
But, the Russell 2000 study cautions that gains accrued from now on are at risk of being wiped out sometime in the not so distant future.
Continued updates along with the most likely long-term forward path for the S&P 500 (this was just published) are available via the Profit Radar Report.
The Profit Radar Report comes with a 30-day money back guarantee, but fair warning: 90% of users stay on beyond 30 days.
Barron's rates iSPYETF a "trader with a good track record," and Investor's Business Daily writes "Simon says and the market is playing along."
|