Elliott Wave Theory (EWT) is the odd ball out of technical analysis. As with anything considered theoretical, the effect of EWT used as a stand alone investment guide could range from invaluable to disappointing. Fused and combined with other facets of technical analysis however, EWT can produce unique insight that no other tool can provide.
Barron's rates iSPYETF as "trader with a good track record" and Investor's Business Daily says: "When Simon says, the market listens." Find out why Barron's and IBD endorse Simon Maierhofer's Profit Radar Report
Entire books have been written about EWT, so the next few paragraphs will by no means constitute a comprehensive explanation of the theory. My goal is to boil down a very complex set of rules and guidelines to a few patterns and clues helpful to market forecasting.
The basic idea behind EWT is that the market doesn’t move from A to B in a straight line. It does so in waves that alternate between pro-trend and counter-trend moves. Like the tide, waves are repetitive and to some degree predictable (being able to predict the next “wave” is the ultimate goal).
The Essence of EWT
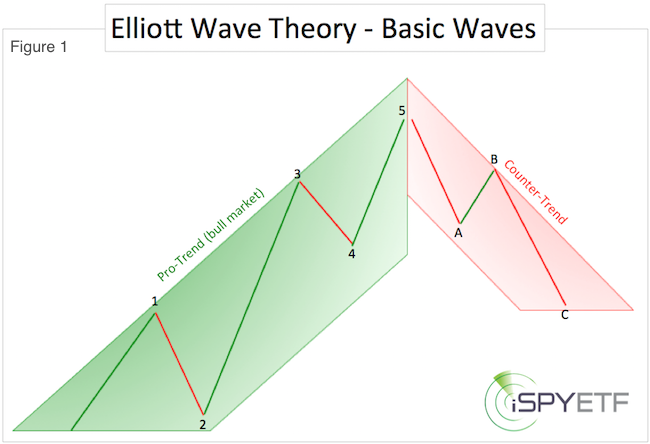
Here is the very essence of EWT: The pro-trend usually moves in a pattern of five discernible waves. The counter-trend tends to move in three, quite commonly hard to identify, waves.
Figure 1 depicts a simplified idealized bullish Elliott Wave cycle. A bearish cycle is the same reversed. Before reading further, take a moment to digest figure 1 as this is the foundation of EWT.

The five-wave pro-trend move is subdivided into three pro-trend (1, 3, 5 – green arrows) and two counter trend (2, 4 – red arrows) waves. The three wave counter-trend pattern (A, B, C) consists of two pro-trend (A, C) and one counter-trend (B) wave.
It is important to keep in mind that EWT is fractal and applies to time frames that can last from a few minutes to several decades. There are always waves within waves. Professional Elliotticians categorize the waves by degree ranging from subminuette (hours and minutes) to grand supercycle (multi-century).
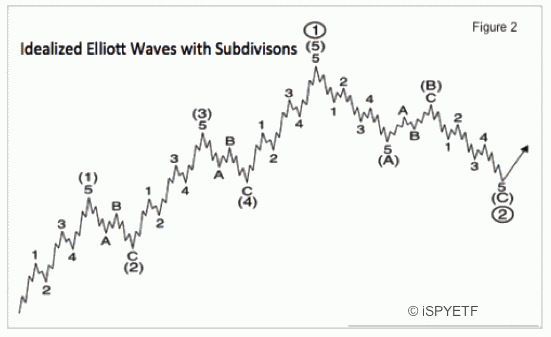
Figure 2 shows an idealized Elliott Wave cycle with sub-waves and the respective labeling. To keep track of the various sub-waves, degrees of cycles are distinguished by circles or brackets. For the purpose of this article we won't worry about circles or brackets and simply label five-wave pro-trend moves as 1, 2, 3, 4, 5 and three-wave counter trend moves as A, B C.

Being familiar with the character of each wave can help navigate the market more successfully.
Surfing the Waves
Wave 1: Depending on the trend, wave 1 kicks off a new bull or bear market and is usually accompanied by sentiment extremes (I.e. October 2007, March 2009). Investors tend to view wave 1 as a mere correction of the previous move. The 320 S&P point drop from October 2007 – March 2008 is considered wave 1 of a new bear market.
Wave 2: Wave 2 retraces a portion of the points lost/gained during wave 1 and usually rekindles the kind of sentiment present at the onset of wave 1. In order to rekindle sentiment extremes, wave 2 tends to move swift and powerfully. The most common retracement target of wave 2 is a Fibonacci 61.8% or 78.6%. Retracements in the QE bull market (post 2009) have often been deeper than normal. Wave 2 can retrace up to 99.9% of the preceededing wave 1.
Wave 3: Wave 3 is the longest and most powerful of all Elliott Waves at least for stocks (for commodities wave 5 can be the most powerful wave). Wave 3 is accompanied by strong breadth, strong fundamentals and a news flow that supports the direction of the market (positive news in a bull market, negative news in a bear market). Wave 3 continues to move higher (or lower) despite overbought (or oversold) momentum and sentiment readings. A common target for wave 3 is a Fibonacci 1.618 of wave 1. The 699 S&P point drop from May – November 2008 is considered a wave 3.
Wave 4: Wave 4 is the most boring and frustrating of all Elliott Waves. It tends to move sideways with a corrective bias. The market appears to be churning aimlessly, investors lose interest, and trading volume declines. Wave 4 tends to retrace around 38.2% of wave 3. The 202 S&P point move from November 2008 – January 2009 is considered a wave 4.
Wave 5: Wave 5 is the final leg in the direction of the dominant trend. The job of wave 5 is to make investors believe it will never end. Wave 5 is where 'smart money' gets out of the market and passes the bag to 'dumb money.' By the time wave 5 reaches its end, sentiment is the polar opposite to what prevailed at the onset of wave 1. Wave 5 is less intense than wave 3 and usually shows a divergence between price and breadth. Wave 5 often ends with a capitulation move. The 277 point move from January – March 2009 was a wave 5.
Trending vs Trend Change
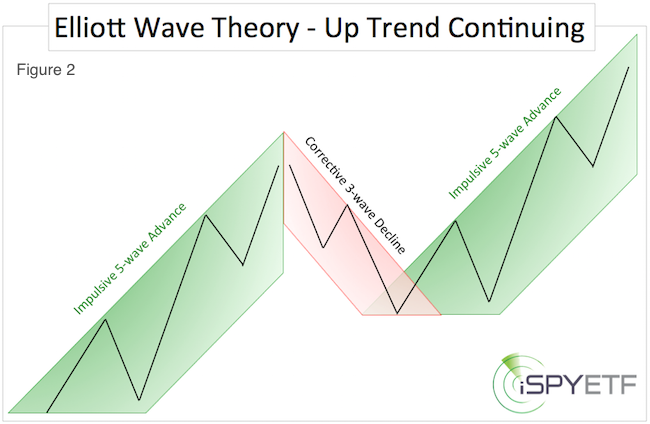
EWT can be helpful in identifying a change of trend. Figure 2 shows the normal structure of a trending market. 5-wave advances are followed by 3-wave corrections.

Figure 3 illustrates how a trend change should look. A 5-wave decline often ends the preceding 5-wave advance (or bull market) and ushers in a move in the opposite direction.

EWT Fractals
Waves occur in fractals in different time frames. Wave sequences occur on minute, hourly, daily, weekly, monthly time frames.
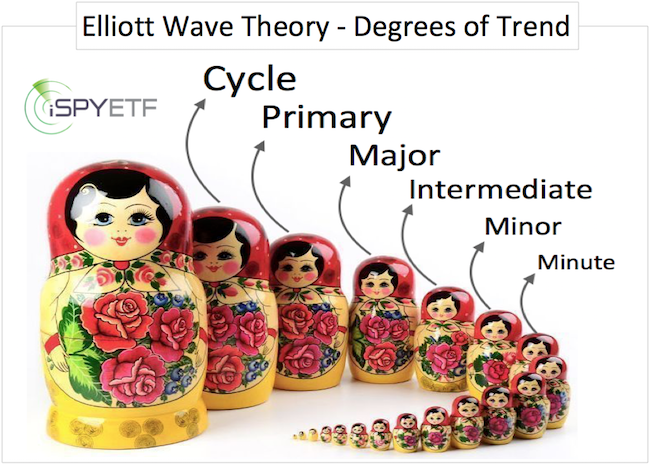
The example of Russian nesting dolls is used to illustrate the different degrees of trend. Here is one way of labeling the fractal size:

-
Cycle
-
Primary
-
Major
-
Intermediate
-
Minor
-
Minute
Elliott Wave Theory is only one of may indicators monitored by the Profit Radar Report.
The Risk/Reward Heat Map provides a simple visual risk vs reward analysis based on hundreds of indicators and studies.
Become the best informed investor you know and sign up for the Profit Radar Report.
Simon Maierhofer is the founder of iSPYETF and the publisher of the Profit Radar Report. Barron's rated iSPYETF as a "trader with a good track record" (click here for Barron's evaluation of the Profit Radar Report). The Profit Radar Report presents complex market analysis (S&P 500, Dow Jones, gold, silver, euro and bonds) in an easy format. Technical analysis, sentiment indicators, seasonal patterns and common sense are all wrapped up into two or more easy-to-read weekly updates.
|