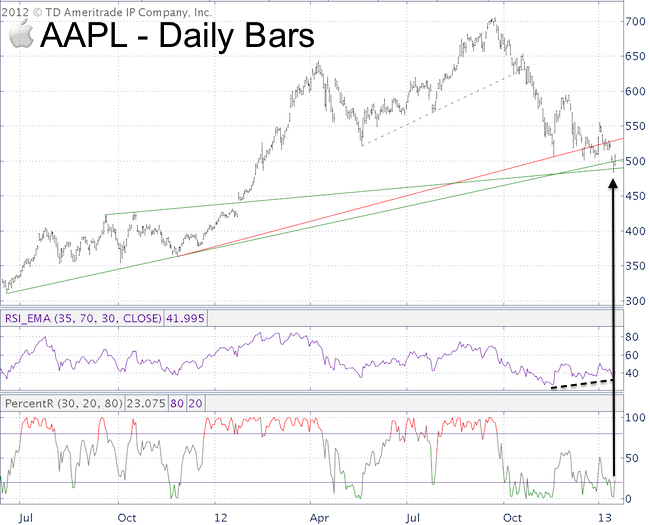
The shares of the world's largest company recovered a bit after falling as much as 31.6%. What’s the bigger story, the 31.6% drop or Wednesday’s 4% recovery?
The chart below shows that Wednesday’s low at 483 occurred right around double green trend line support.

This is pretty much in line with the expectation I shared via the December 10, article about Apple here on iSPYETF: “It seems to me that Apple is heading for a new low, perhaps around 480 – 490.”
The same article stated that: “A new low unconfirmed by a new RSI low would create a bullish divergence and possibly prove as a springboard for a more sustainable rally into Q1 2013.”
The new low was carved out against a bullish RSI divergence. Will that be enough to get Apple shares moving higher again?
percentR, the same indicator we used to confirm Apple’s top, has moved from below to above 20. This is considered a bearish low-risk entry. The regular ‘default trade’ is to go short with a stop-loss (based on closing prices) at Wednesday’s high.
However, going short may not be the greatest idea since Apple precisely hit our down side target against a bullish RSI divergence. It may be better to use RSI as an initial change of trend confirmation. A close above 510 would be positive.
Apple Sentiment Gauges
I like looking at sentiment extremes to gain an extra edge. Bullish extremes are bearish for the stock and vice verse. Unfortunately, there are no sentiment extremes for Apple.
The short interest on AAPL is within the normal range (about 2% of outstanding shares) as is the options put/call ratio. Other options measure a closer to optimistic than pessimistic extreme, which is odd considering Apple’s 31% tumble.
Apple Cycles and Seasonality
AAPL has enjoyed a multi-year bull market with average annual gains of 63% since 1998 (the first year of profitability after Steve Job’s return to Apple).
For that reason Apple’s seasonality has a distinct bullish bias. The beginning of the year is generally less bullish for Apple shares, but obviously a 14-year predominantly bullish seasonality chart is little help during this bear market period.
Summary
Sentiment and seasonality don’t provide much of an edge, so we’ll keep technicals in the driver’s seat. Based on the bullish RSI divergence there’s good potential for a bounce. percentR suggests to wait for a close above 510 before going long.
Due to the potential for an upcoming S&P 500 reversal, it will be smart to elevate stop-losses if prices do rally and keep a stop loss no lower than 480 initially.
|