Hitching a portfolio to small cap stocks has been a sure ticket for a rollercoaster ride.
We won’t even talk about the last two years of high volatility without any net progress. Just over the past month, the Russell 2000 went from a bullish breadth thrust to a ‘death cross.’
Will the death cross over-power the breadth thrust or vice versa?
Breadth thrust
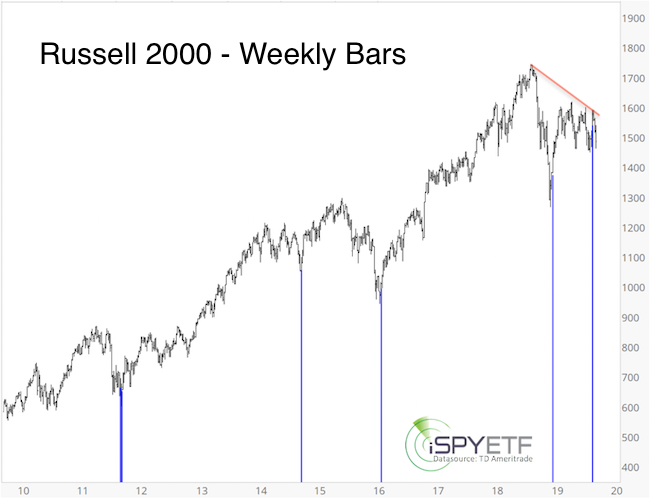
What was the breadth thrust? From September 9 - 11, the Russell 2000 rallied more than 1% on three consecutive days. When coming from a 6-month low, that has happened only five other times over the past decade (see blue bars).

As the blue bars show, the Russell 2000 rallied strongly almost immediately every time. Despite the signal's solid track record, the September 11 Profit Radar Report noted the over-bought condition against resistance (red line) and warned that: "The setup is not ideal for a buy signal."
Barron's rates iSPYETF as "trader with a good track record" and Investor's Business Daily says: "When Simon says, the market listens." Find out why Barron's and IBD endorse Simon Maierhofer's Profit Radar Report.
Death cross
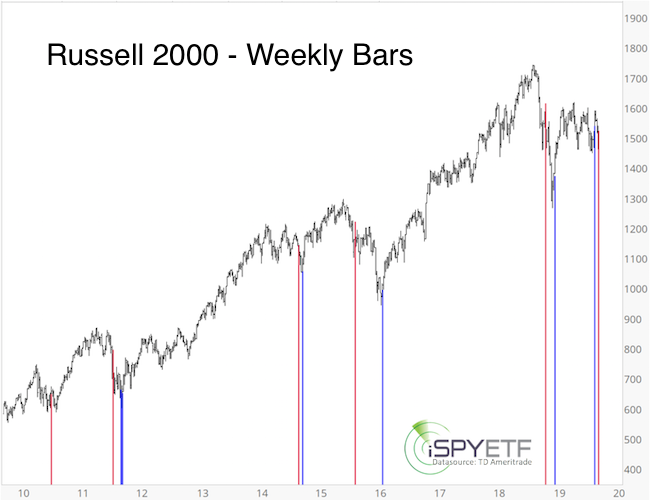
Only 16 days after the breadth thrust, the Russell 2000 and corresponding iShares Russell 2000 ETF (IMW) suffered a death cross.
The red bars highlight every death cross over the past ten years. Although I'm not a fan of the fear-mongering death cross label, 1-2 months after each death cross the Russell 2000 traded lower every time. The last two death crosses (11/13/2018 and 9/2/2015) were particularly unkind.

Trouble shooting
Why did the breadth thrust fail?
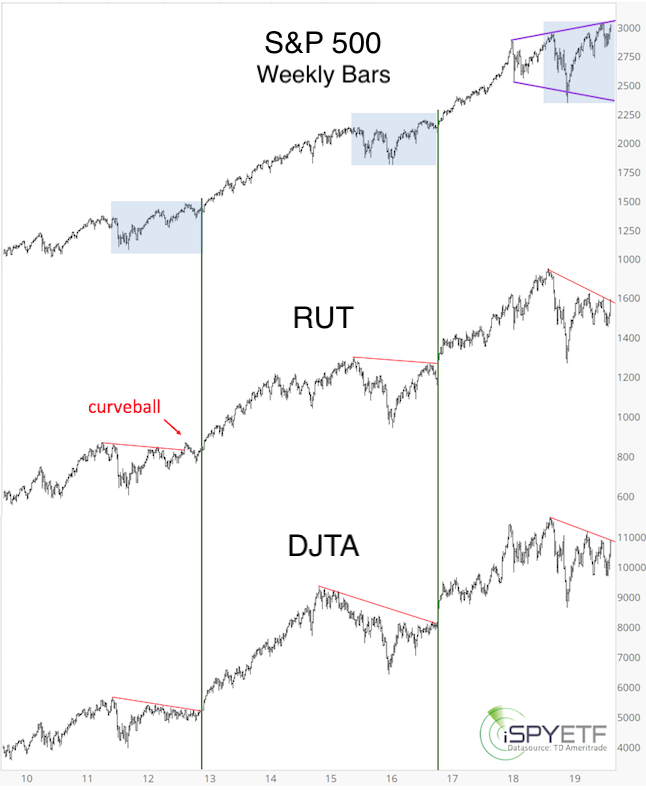
Because the Russell 2000 could not make it above resistance. In fact, not only the Russell 2000 ran into resistance, the S&P 500 and Dow Jones Transportation Average did too.
If you enjoy quality, hand-crafted research, >> Sign up for the FREE iSPYETF e-Newsletter
I published this triple index resistance chart in the September 15, Profit Radar Report and warned that:
“The S&P 500, Russell 2000 and Dow Jones Transportation Average are at an inflection point. While the S&P 500 remains below purple trend line resistance, we allow seasonality and cycles to pull stocks back down.”

Conclusion
The two diametrically opposed Russell 2000 signals discussed above illustrate a much larger conflict. Over a month ago (September 1, Profit Radar Report) I found a lot of conflict among indicators.
Some breadth measures were strong, some weak, short-term cycles were up, but longer-term cycles down, etc.). Usually when that happens, the market stays range bound.
I personally would like to see lower prices, and the Russell 2000 death cross supports that conclusion. However, there are a number of sentiment readings that may limit down side in terms of size of length.
Continued updates, projections, buy/sell recommendations are available via the Profit Radar Report.
Simon Maierhofer is the founder of iSPYETF and the publisher of the Profit Radar Report. Barron's rated iSPYETF as a "trader with a good track record" (click here for Barron's evaluation of the Profit Radar Report). The Profit Radar Report presents complex market analysis (S&P 500, Dow Jones, gold, silver, euro and bonds) in an easy format. Technical analysis, sentiment indicators, seasonal patterns and common sense are all wrapped up into two or more easy-to-read weekly updates. All Profit Radar Report recommendations resulted in a 59.51% net gain in 2013, 17.59% in 2014, 24.52% in 2015, 52.26% in 2016, and 23.39% in 2017.
|