Last week, the Profit Radar Report stated that: “We would be interested to buy if the S&P 500 drops below 2,810 and subsequently rallies back above 2,830. Although we don’t know how much the S&P would rally, we want to have some skin in the game.”
Barron's rates iSPYETF as "trader with a good track record" and Investor's Business Daily says: "When Simon says, the market listens." Find out why Barron's and IBD endorse Simon Maierhofer's Profit Radar Report.
Considering that the S&P closed at 2,891.31 last Friday, a buy limit at 2,810 seemed ridiculous, but Monday saw the S&P drop 90 points.
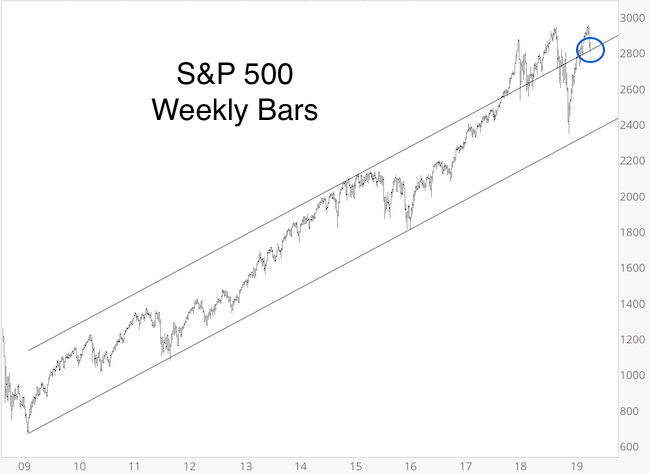
Here is why 2,810 was an important level to watch:
-
Long-term trend channel support (going back to 2009)
-
Short-term trend channel support
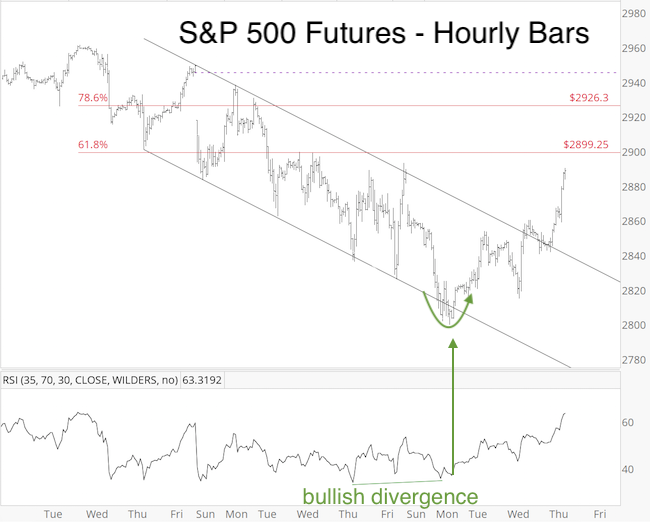
On Monday (May 13), S&P 500 Futures briefly dipped below and right away snapped back above the lower trend channel line (at 2,810, green arrow). This price pattern along with the bullish RSI-35 divergence suggested some kind of low was struck.
Based on Elliott Wave Theory, this bounce should run into trouble somewhere around 2,900.
* * * * * * * * * * * * * * * * * * * * * * * * * * * *
May 13, 2019 (9:55pm PST)
The structure from the May 1 high is probably best counted as a 5-wave move that should complete (or near complete – RSI-2 allows for more down side) wave a or 1 within a leading diagonal. The chart below shows common Fibonacci retracement levels and a projected path. The dashed lines show that price may fall short or exceed the 61.8% Fibonacci target (to close open chart gaps at 2,931.35, 2943.51).
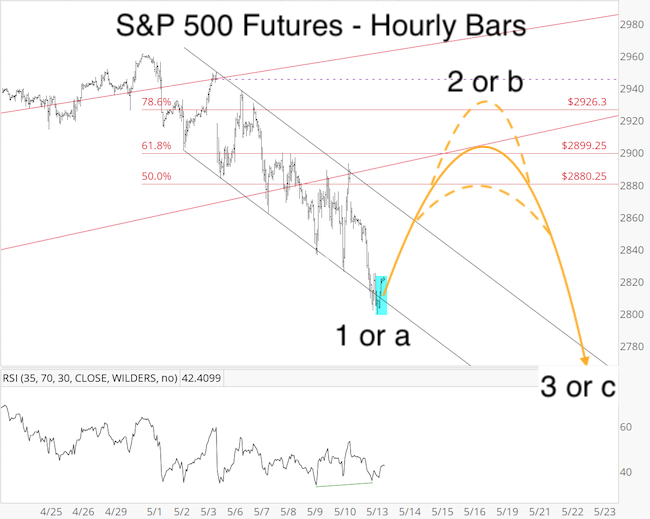
As projected, odds favor a new low after this bounce, but we’ve seen bounces go further than expected before. We’d prefer to eventually buy at lower levels, but lower levels may or may not occur. As a compromise and insurance, we will commit half a position to buy the S&P 500 (via SPY) at the open (as long as it is below 2,830).
* * * * * * * * * * * * * * * * * * * * * * * * * * *
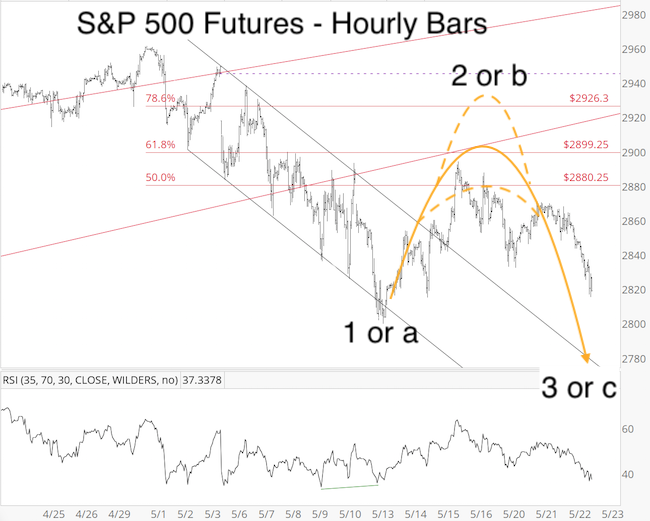
UPDATE 5-23-2019:
Below is an updated version of the chart featured in the May 13 Profit Radar Report:
* * * * * * * * * * * * * * * * * * * * * * * * * * * *
Price and momentum studies are not nearly as bearish as Elliott Wave Theory, so stocks could also move higher than expected.
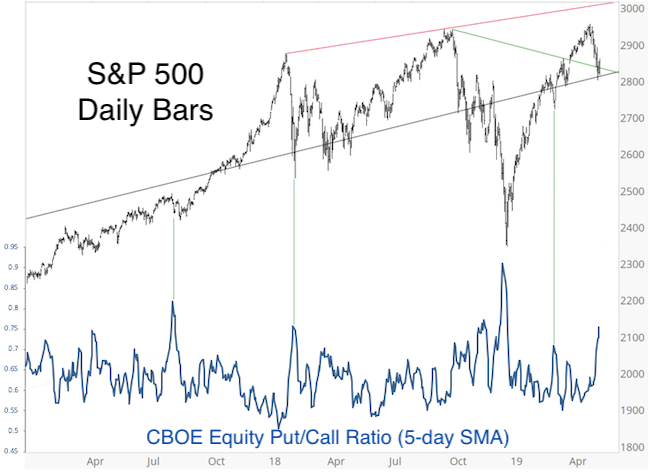
The elevated CBOE Equity Put/Call Ratio (5-day SMA currently at 0.76, see chart above) certainly allows for further up-side (readings above 0.7 are generally seen near lows).
Regardless of the longevity of this bounce, the reversal at the long-and short-term trend channels at 2,810 provided an opportunity to gain some exposure at low prices (our actual buying price ended up being 2,820.21), which is better than being tempted to chase price at higher and riskier levels.
Continued updates are available via the Profit Radar Report
Simon Maierhofer is the founder of iSPYETF and the publisher of the Profit Radar Report. Barron's rated iSPYETF as a "trader with a good track record" (click here for Barron's evaluation of the Profit Radar Report). The Profit Radar Report presents complex market analysis (S&P 500, Dow Jones, gold, silver, euro and bonds) in an easy format. Technical analysis, sentiment indicators, seasonal patterns and common sense are all wrapped up into two or more easy-to-read weekly updates. All Profit Radar Report recommendations resulted in a 59.51% net gain in 2013, 17.59% in 2014, 24.52% in 2015, 52.26% in 2016, and 23.39% in 2017.
|