This is a shorter-term Elliott Wave Theory-based forecast. A longer-term forecast based on a different set of reliable indicators is available here.
Most of February's market action was outright boring!
Starting in late February, however, boring morphed into revealind. The range bound trading actually provided clarity.
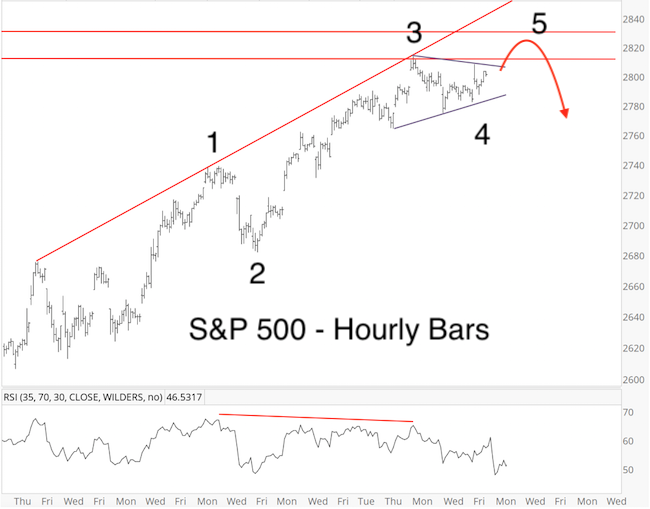
Via the February 27 Profit Radar Report, I pointed out a possible S&P 500 triangle formation. The chart below (published in the March 3 Profit Radar Report) illustrated the triangle formation as it corresponds to Elliott Wave Theory.
Barron's rates iSPYETF as "trader with a good track record" and Investor's Business Daily says: "When Simon says, the market listens." Find out why Barron's and IBD endorse Simon Maierhofer's Profit Radar Report.
Pop and Drop
In short, the triangle was to be followed by a pop and drop.
As the updated price chart shows, this is what happened.
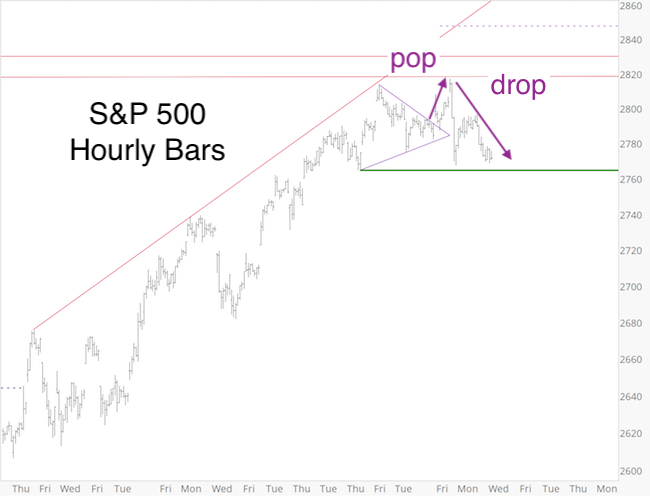
The green line highlights important support provided by the February 21 low (2,764,55).
I don't think it will, but as long as this support holds, a different kind of Elliott Wave Theory formation - a more complex ‘flat triangle’ - is possible (see blue lines in chart below).
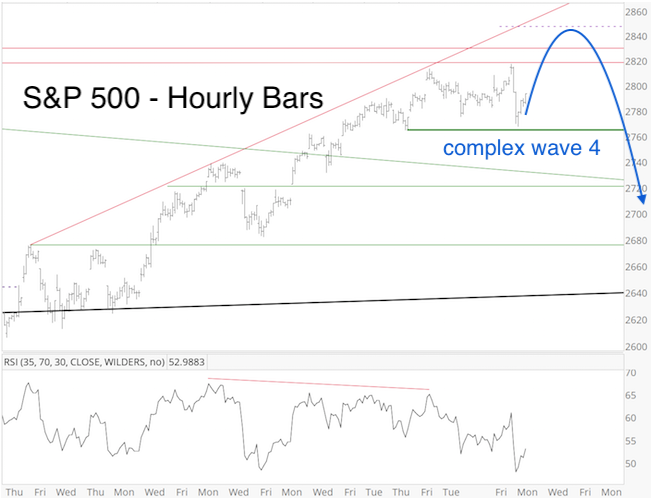
Regardless, the post triangle pop should be wave 5, which marks the completion of this particular rally leg. The wave 5 high likely occurred already on Monday (2,816.88).
If you enjoy quality, hand-crafted research, >> Sign up for the FREE iSPYETF e-Newsletter
Regardless, a pullback is here or near. How much of a pullback?
How Big of a Drop?
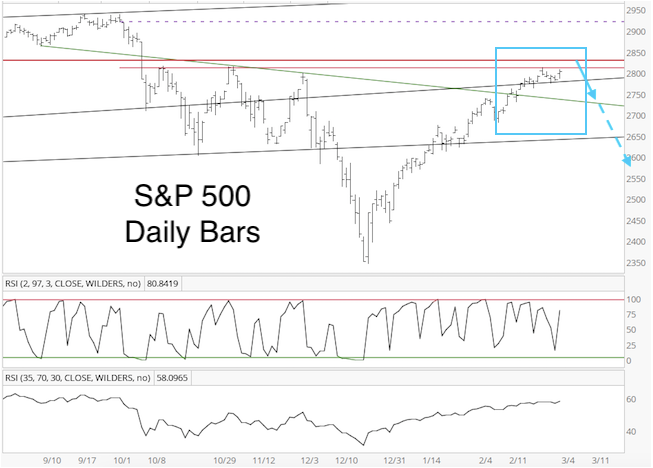
It’s been difficult to count the rally from the December low in terms of Elliott Wave Theory, but the rally from the February 21 low has taken the shape of 5 waves (see above charts).
A completed 5-wave rally is always followed by a pullback. The question is this: Does the 5-wave rally complete only a small rally leg (going back to early February) or the entire rally from the December 24 low?
The blue box highlights the discussed 5-wave sequence (chart published in the March 3 Profit Radar Report). We know that this portion of the rally should be retraced for sure (solid blue arrow). However, it's possible that the latest 5-wave sequence ends a larger A-B-C or 5-wave advance, which would suggest a much deeper drop (dashed blue line).
The S&P 500 futures chart, published in the March 3 Profit Radar Report, shows an ominous wedge formation with decreasing volume, which could translate into significant down side risk.
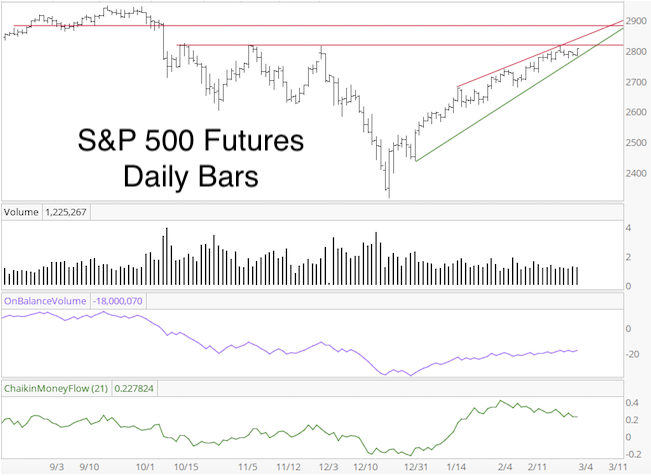
It looks like the minimum down side target is around 2,720, but a drop to 2,600 (and lower) seems quite likely.
We will asses down side risk as the decline progresses.
Continued updates are available via the Profit Radar Report.
Simon Maierhofer is the founder of iSPYETF and the publisher of the Profit Radar Report. Barron's rated iSPYETF as a "trader with a good track record" (click here for Barron's evaluation of the Profit Radar Report). The Profit Radar Report presents complex market analysis (S&P 500, Dow Jones, gold, silver, euro and bonds) in an easy format. Technical analysis, sentiment indicators, seasonal patterns and common sense are all wrapped up into two or more easy-to-read weekly updates. All Profit Radar Report recommendations resulted in a 59.51% net gain in 2013, 17.59% in 2014, 24.52% in 2015, 52.26% in 2016, and 23.39% in 2017.
Follow Simon on Twitter @ iSPYETF or sign up for the FREE iSPYETF e-Newsletter to get actionable ETF trade ideas delivered for free.
|