In mid-January, I asked: Is the ‘Bear Market’ Already Over?
The above article highlighted bearish (bullish for stocks) sentiment extremes, the average bear market trajectory (which projected a rally), and - most importantly - a bullish breadth thrust.
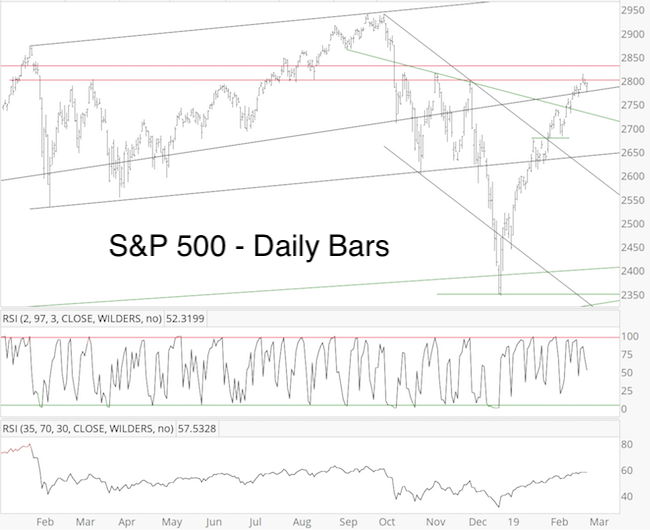
Therefore it’s no surprise that stocks continued higher. What is surprising (at least to me), is that they did so without any real pullback. Strong momentum overrode any pullback attempts.

This is highly unusual.
The January 30, 2019 Profit Radar Report stated that: “Based on the most likely Elliott Wave Theory count, upcoming gains should be choppy as waves 4 and 5 of various degrees unfold.”
Barron's rates iSPYETF as "trader with a good track record" and Investor's Business Daily says: "When Simon says, the market listens." Find out why Barron's and IBD endorse Simon Maierhofer's Profit Radar Report.
The market sure has been choppy, but continues to grind higher.
This comment in the February 12 Profit Radar Report highlights the conundrum of whether to chase price or not (back then and today):
“The S&P 500 is on the cusp of breaking above resistance, and based on after-hours action is likely to do so tomorrow. Forward looking indicators (like Elliott Wave Theory) suggest this rally leg will relapse, but momentum and the technical breakout could over-power future expectations in real time.”
I recommended an official buy limit order for the SPDR S&P 500 ETF (SPY), but later down graded it to a buy recommendation for aggressive investors only.
The S&P 500 has now arrived at another juncture.
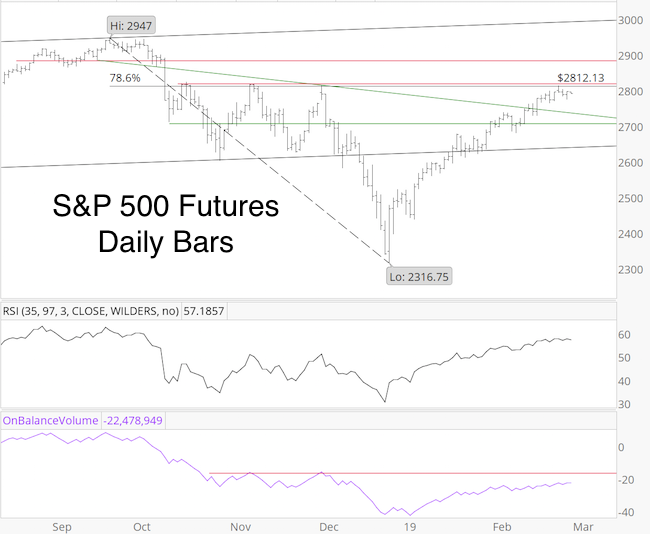
The S&P 500 futures chart shows that 2,812 - 2,818 is important. Sometimes important price levels are subject to a brief seesaw.
If you enjoy quality, hand-crafted research, >> Sign up for the FREE iSPYETF e-Newsletter

In fact, there’s a pattern right now that - if in place - projects a pop and drop.
I’ve seen a couple of those patterns fail recently, so in order for the pop and drop pattern to gain teeth, the S&P will have to pop above resistance and thereafter drop below resistance.
If that happens, the down side risk could be quite significant.
Continued updates are available via the Profit Radar Report.
Simon Maierhofer is the founder of iSPYETF and the publisher of the Profit Radar Report. Barron's rated iSPYETF as a "trader with a good track record" (click here for Barron's evaluation of the Profit Radar Report). The Profit Radar Report presents complex market analysis (S&P 500, Dow Jones, gold, silver, euro and bonds) in an easy format. Technical analysis, sentiment indicators, seasonal patterns and common sense are all wrapped up into two or more easy-to-read weekly updates. All Profit Radar Report recommendations resulted in a 59.51% net gain in 2013, 17.59% in 2014, 24.52% in 2015, 52.26% in 2016, and 23.39% in 2017.
Follow Simon on Twitter @ iSPYETF or sign up for the FREE iSPYETF e-Newsletter to get actionable ETF trade ideas delivered for free.

|