From December 3 - December 26, 2018, the S&P 500 lost 453 points. Since then, the S&P rallied 400 points.
Who would have thought that the worst December since 1931 would be followed by the best January since 1987?
Extremes Everywhere
We are truly living in a world of extremes. The rich are getting richer, the poor are getting poorer while historic heat waves and polar vortexes ravage the globe. Stock market extremes fit into the picture.
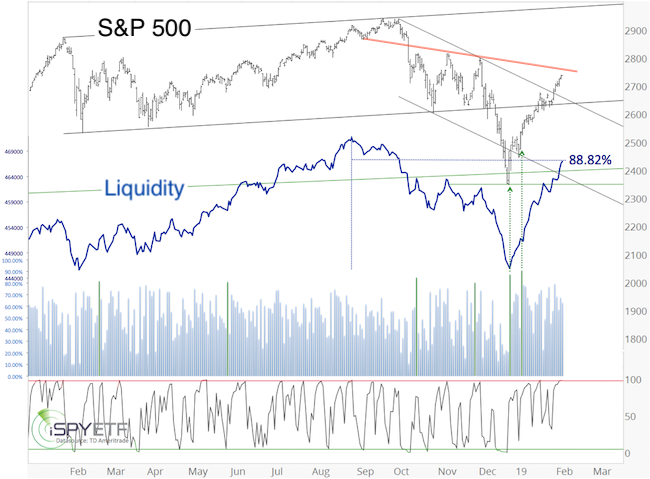
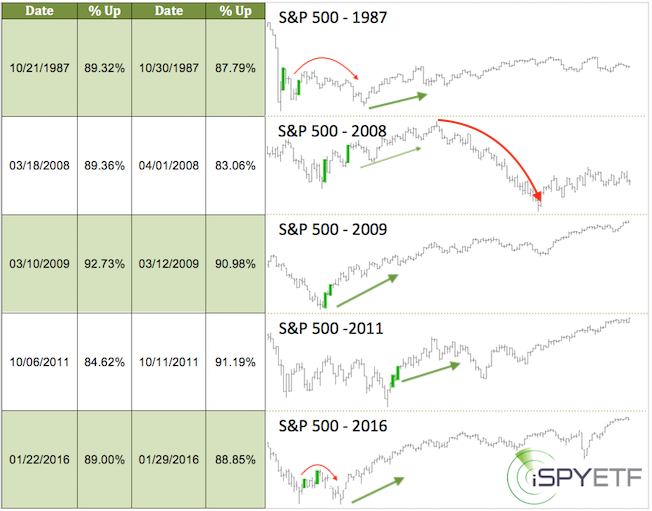
Although the relentlessness of this rally was unexpected (at least for me), the Profit Radar Report highlighted a tell tale sign of the latest buying extreme when 90% of NYSE-traded stocks advanced on January 4 (blue columns).
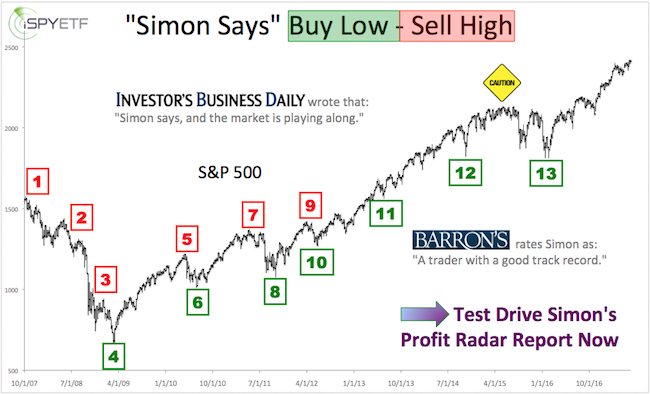
Barron's rates iSPYETF as "trader with a good track record" and Investor's Business Daily says: "When Simon says, the market listens." Find out why Barron's and IBD endorse Simon Maierhofer's Profit Radar Report.
As the table and thumbnail charts below shows (originally published in the January 9 Profit Radar Report), this kind of breadth and momentum thrust is rare and almost always long-term bullish.
Confirmation?
The initial thrust is thus far confirmed by my favorite liquidity indicator (blue graph, first chart), which has already retraced 88.82% of its prior losses, significantly more than the 63% S&P 500 retracement.
If you enjoy quality, hand-crafted research, >> Sign up for the FREE iSPYETF e-Newsletter
A new high of the liquidity indicator prior to a S&P 500 high will be additional confirmation of further gains.
Momentum vs Over-bought
The S&P 500 ended Tuesday overbought (based on RSI-2 - bottom graph, first chart). This is not the first time the S&P has become over-bought, but in 2019 it’s been a ‘mind of matter’ pattern; As long as the market doesn’t mind, it doesn’t matter.
Red line resistance, the next potential speed bump, is around 2,745.
The Elliott Wave pattern for almost every major index is up to interpretation, but the Nasdaq-100 QQQ ETF pattern offers slightly more clarity than others.
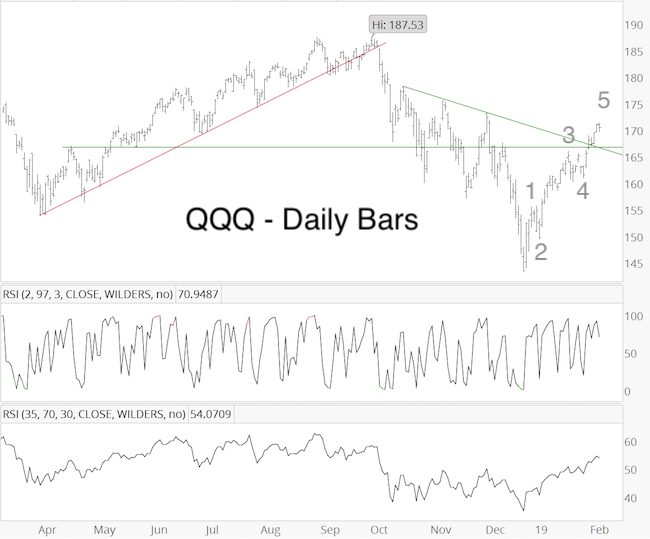
As the chart above shows, QQQ could be completing a 5-wave move. Upon completion, a 5-wave move is followed by a correction (quite commonly a nasty one), and further gains.
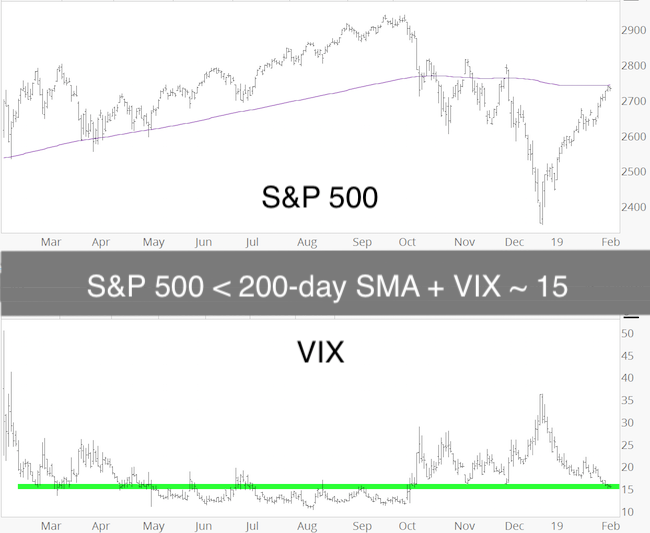
One anomaly that also cautions against chasing stocks at this stage is the VIX. As the chart above shows, the VIX has fallen back to support around 15, in fact, it's at the lowest level since October. At the same time, the S&P 500 is still below its 200-day SMA.
It's unusual for the VIX to drop to a 3-4 month low while the S&P is still below its 200-day SMA. In fact, over the past 20 years it only happened during the 2001/02 and 2008 bear markets. Forward returns were consistently negative.
In summary, chasing stocks at this stage does not seem prudent. There should be a pullback ... and who knows, perhaps the pullback also gathers momentum. We'll evaluate when we get there.
Continued updates are available via the Profit Radar Report.
Simon Maierhofer is the founder of iSPYETF and the publisher of the Profit Radar Report. Barron's rated iSPYETF as a "trader with a good track record" (click here for Barron's evaluation of the Profit Radar Report). The Profit Radar Report presents complex market analysis (S&P 500, Dow Jones, gold, silver, euro and bonds) in an easy format. Technical analysis, sentiment indicators, seasonal patterns and common sense are all wrapped up into two or more easy-to-read weekly updates. All Profit Radar Report recommendations resulted in a 59.51% net gain in 2013, 17.59% in 2014, 24.52% in 2015, 52.26% in 2016, and 23.39% in 2017.
Follow Simon on Twitter @ iSPYETF or sign up for the FREE iSPYETF e-Newsletter to get actionable ETF trade ideas delivered for free.
|