In late October we were looking for a strong counter trend rally (S&P 500 projection published here), and wanted to short the S&P 500 in the 2,830 - 2,850 zone (red bar). The S&P fell short of our target, and relapsed at 2,817.
This week we wanted to buy the S&P 500 after a brief dip below trend channel support (2,615 - green bar). Again, the S&P fell short of our target, and bounced from 2,631.
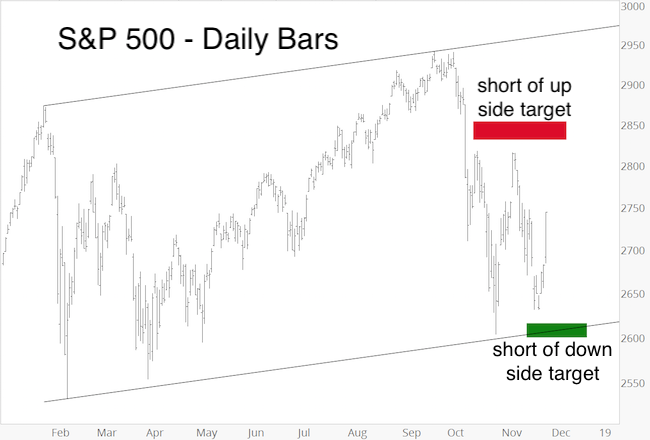
Why is the market falling short of our targets, and what does it mean?
Long-term Outlook Explains Short-term Movements
Here is one explanation (in my humble opinion the most plausible one):
In mid-October I analyzed various indicators to help determine the S&P’s larger pattern, and ideally future path. Indicators included:
-
Breadth & momentum
-
Price patterns
-
Support & resistance levels
-
Liquidity & breath
-
Investor sentiment
-
Elliott Wave Theory
-
Seasonality & cycles
The entire analysis, along with the three most likely scenarios were published in the October 14 Profit Radar Report.
Barron's rates iSPYETF as "trader with a good track record" and Investor's Business Daily says: "When Simon says, the market listens." Find out why Barron's and IBD endorse Simon Maierhofer's Profit Radar Report.
The chart and commentary below were published as scenario #1:
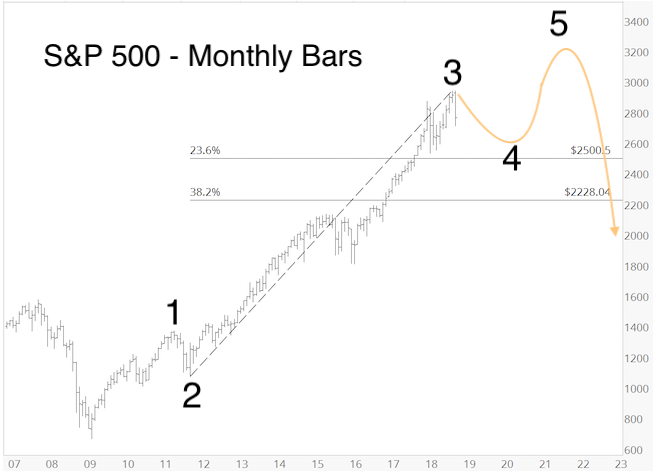
“Scenario #1: The September high is wave 3 (primary degree). The current decline is wave 4. Waves 4 are generally choppy, drawn out, frustrating and nearly impossible to predict. Shown are the two most common Fibonacci retracement (down side) targets:
-- 23.6%: 2,500 -- 38.2%: 2,228. Once this correction is complete, the stock market will rally to its final bull market high (wave 5).
Although a new multi-year bear market with much lower targets is possible, the size of the bearish divergence at the September high and lack of absolute investor bullishness surrounding the top, suggest that scenario #1 or #2 are more likely than #3.”
"Waves 4 are generally choppy, drawn out, frustrating and nearly impossible to predict." True to that! Although we correctly anticipated the decline from the 2,800s and the bounce from the 2,600s, the notion that the S&P is in a larger-scale wave 4 correction would explain why price keeps falling short of my targets.
Short-term Outlook
The hourly chart below, published in the November 27 Profit Radar Report, showed that 2,685 was a short-term inflection point, because that’s where a number of trend lines met up with an open chart gap.
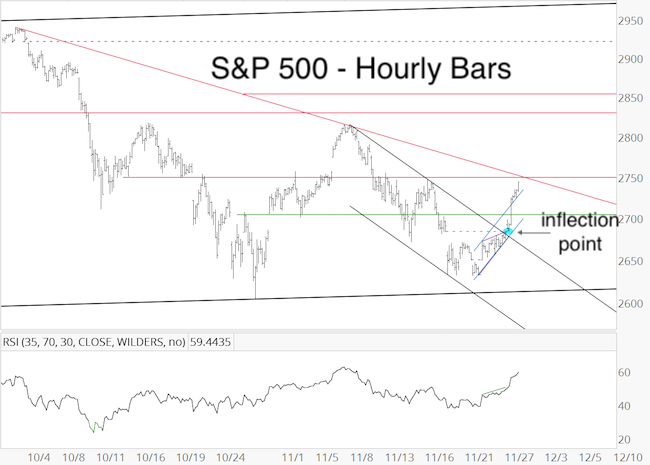
As it turns out, the break above 2,685 uncorked quite a pop (I personally would have preferred a drop). Next resistance is not far away, but as long as trade remains above the breakout level (2,685), it can continue to move higher (likely in a choppy fashion) … and reach the 2,830 - 2,850 range missed earlier this month.
If you enjoy quality, hand-crafted research, >> Sign up for the FREE iSPYETF e-Newsletter
Nasdaq-100 - QQQ ETF
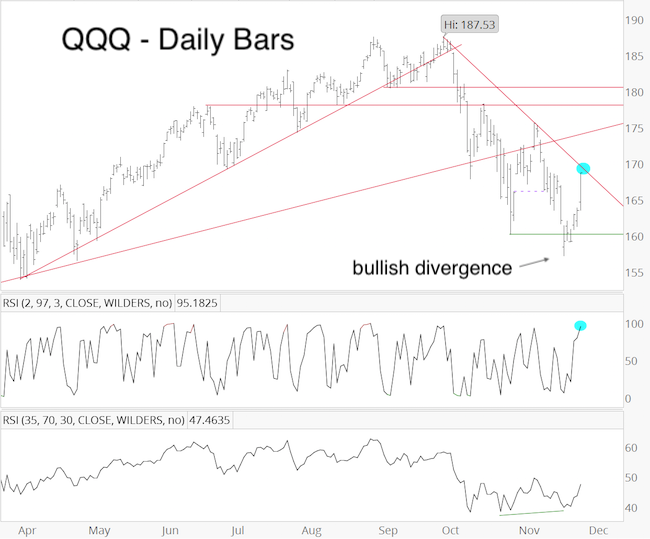
Unlike the S&P 500, the Nasdaq-100 QQQ carved out a bullish divergence at the November 20 low. The November 21 PRR stated that: “The Nasdaq-100 QQQ gave back most of its gains, but closed above short-term support. Since QQQ already carved out a bullish divergence, bulls already have their window of opportunity to take trade higher, as long as support around 160 holds.”
Bulls took advantage of their window of opportunity, but resistance is not far away, and RSI-2 is nearing over-bought.
Summary
First the S&P 500 missed our up side target (2,830 - 2,850), then our down side target (2,615).
This is likely caused by the unpredictable nature of choppy wave 4 corrections. Nevertheless, the weight of evidence suggests that the S&P will hit (and exceed) both of the above target zones in the coming weeks/monhts.
Continued updates are available via the Profit Radar Report.
Simon Maierhofer is the founder of iSPYETF and the publisher of the Profit Radar Report. Barron's rated iSPYETF as a "trader with a good track record" (click here for Barron's evaluation of the Profit Radar Report). The Profit Radar Report presents complex market analysis (S&P 500, Dow Jones, gold, silver, euro and bonds) in an easy format. Technical analysis, sentiment indicators, seasonal patterns and common sense are all wrapped up into two or more easy-to-read weekly updates. All Profit Radar Report recommendations resulted in a 59.51% net gain in 2013, 17.59% in 2014, 24.52% in 2015, 52.26% in 2016, and 23.39% in 2017.
Follow Simon on Twitter @ iSPYETF or sign up for the FREE iSPYETF e-Newsletter to get actionable ETF trade ideas delivered for free.
|