On June 6, I published a bigger picture S&P 500 outlook. Since this update builds on the June 6 outlook, you may find it helpful to first read the June 6 bigger picture S&P 500 outlook.
For the past few months we’ve been looking to buy the S&P 500 on dips. We bought the SPDR S&P 500 ETF (SPY) on April 3 and May 31.
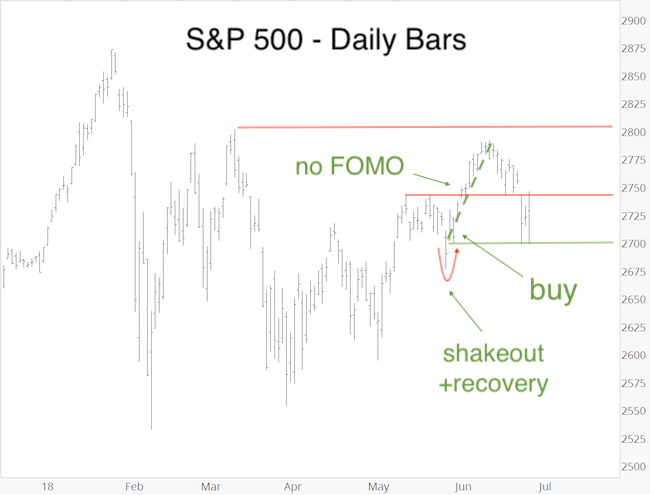
As mentioned in the June 6 outlook, the May 29 shakeout and May 30 recovery (see chart below) increased the odds that either a low is in place or that a more significant rally is developing. Our upside target mentioned in the June 13 PRR was 2,800 - 2,830.
There was one caveat mentioned in the June 6 outlook (and May 30 Profit Radar Report): “Since the S&P still remains in its larger trading range, it is impossible to confirm for certain that wave 4 is indeed complete. Nevertheless, unless the S&P drops back below 2,700 (and the May 29 low), we will assume that a low is in. Additional support worth watching is around 2,740.”
This week support at 2,740 failed, and the S&P swiftly dropped to 2,700.
Not profitable, but Successful
Our SPY sell limit was waiting at 280.50 (S&P 2,810), but SPY reversed before, and Profit Radar Report subscribers got stopped out of SPY at breakeven (271.25, which correlates to 2,710 for the S&P 500). Although the SPY trade was not profitable, it was a success! Why?
Barron's rates iSPYETF as "trader with a good track record" and Investor's Business Daily says: "When Simon says, the market listens." Find out why Barron's and IBD endorse Simon Maierhofer's Profit Radar Report.
When the S&P 500 rallied more than 100 points from the May 31 low, we did not feel the need to chase price, because we bought near the low, and had skin in the game. Based on various sentiment readings, many investors suffered from FOMO (= fear of missing out) and bought near the high.

Back to square one. Pause and reset.
The break below 2,740 opens various short-term (and longer-term) possibilities, many of which point to a choppy market.
If you enjoy quality, hand-crafted research, >> Sign up for the FREE iSPYETF Newsletter
Evaluate and Cross-check
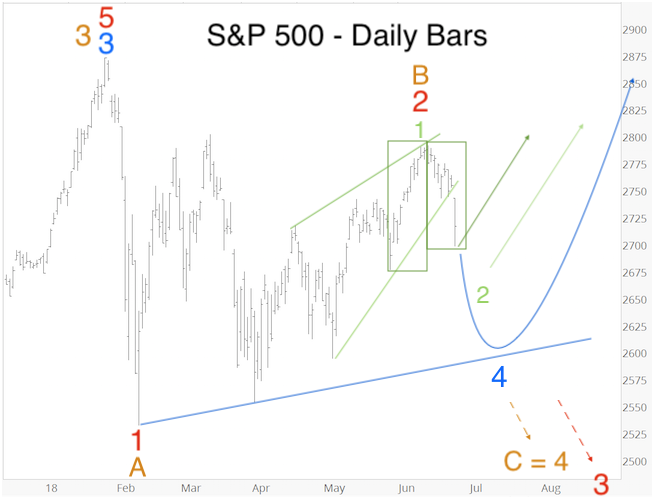
The chart below outlines 5 possible scenarios based on Elliott Wave Theory (the chart below makes more sense when read in context with the bigger picture S&P 500 outlook). They range from immediately bullish (dark green) to short- and long-term bearish (blue, orange and red).

The Profit Radar Report tends to monitor multiple scenarios and cross-checks them against other indicators (technicals, sentiment, liquidity, seasonality/cycles, etc.) to assess each scenarios viability and probability.

For example, our trusted liquidity indictor already eliminated 2 of the 5 scenarios illustrated above.
In short, we remain in “buy the dip mode,” the question is just how big of a dip we’ll get. For someone who just got stopped out at 2,710, worst case scenario would be a strong, immediate rally (dark green scenario above).
Continued updates are available via the Profit Radar Report.
Simon Maierhofer is the founder of iSPYETF and the publisher of the Profit Radar Report. Barron's rated iSPYETF as a "trader with a good track record" (click here for Barron's profile of the Profit Radar Report). The Profit Radar Report presents complex market analysis (S&P 500, Dow Jones, gold, silver, euro and bonds) in an easy format. Technical analysis, sentiment indicators, seasonal patterns and common sense are all wrapped up into two or more easy-to-read weekly updates. All Profit Radar Report recommendations resulted in a 59.51% net gain in 2013, 17.59% in 2014, 24.52% in 2015, 52.26% in 2016, and 23.39% in 2017.
Follow Simon on Twitter @ iSPYETF or sign up for the FREE iSPYETF Newsletter to get actionable ETF trade ideas delivered for free.

If you enjoy quality, hand-crafted research, >> Sign up for the FREE iSPYETF Newsletter
|