This is the first time we've made available a series of Profit Radar Report updates for free. Enjoy!
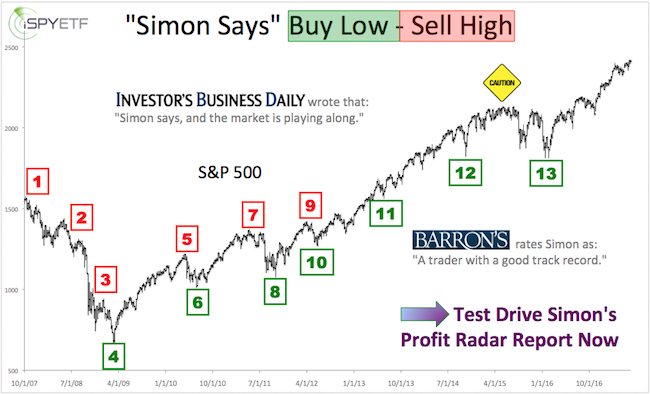
Barron's rates iSPYETF as "trader with a good track record" and Investor's Business Daily says: "When Simon says, the market listens." Find out why Barron's and IBD endorse Simon Maierhofer's Profit Radar Report.

April 4, 2018 (6:00pm PST)
Yesterday’s PRR stated that: “We will set our stop-loss at breakeven. If SPY gaps below 258.87 in the morning, we will keep our stop-loss at 256.”
Since SPY gapped lower and opened at 256.75, we set our stop-loss at 256. After another 200-day SMA seesaw, SPY closed at 263.56. We will now raise our stop-loss back to breakeven (258.87).
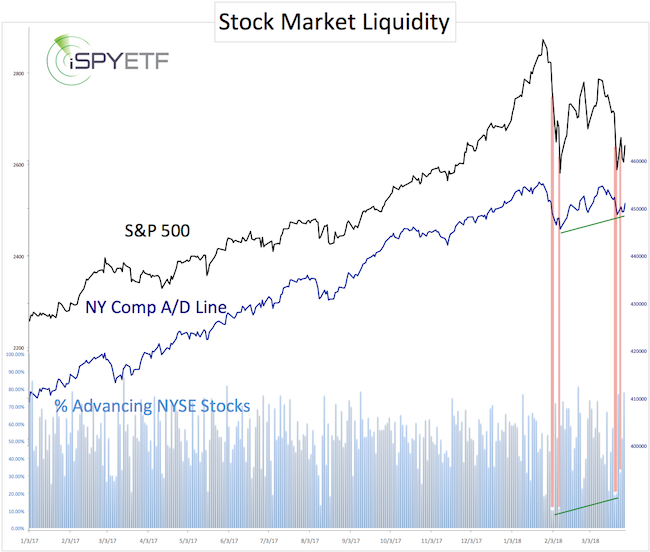
Monday’s PRR mentioned that the NY Composite a/d line is still above its February and March lows. The chart below provides more details. From March 23 – April 2, the S&P 500 drifted lower, while the NYC a/d line inched higher. This bullish divergence suggests that selling pressure is abating.
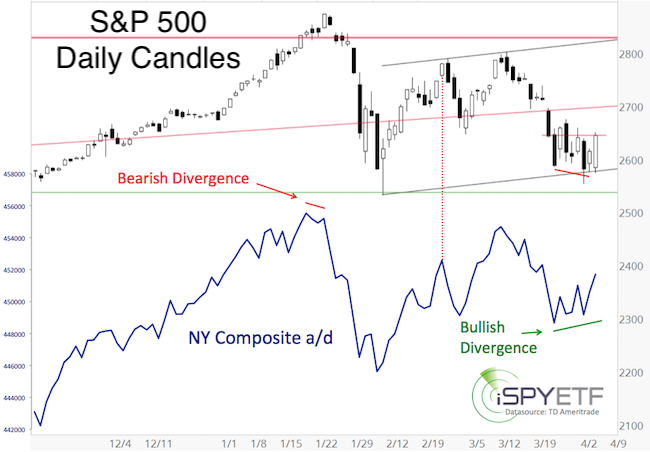
This fact, in addition to the S&P 500, DJIA and Nasdaq-100 hitting our down side targets and/or support (March 28 PRR) contributed to the SPY buy signal.
However, bullish outlooks are rare. In fact, some Elliott Wave Theory analysts are vehemently bearish, which is reminiscent of early March, when the March 7 PRR published the chart below and stated:
“This is one of those times where it’s dangerous to rely solely on Elliott Wave Theory (EWT). Some EWT analysts currently advocate a 1 – 2 constellation to the up side (green labels), others a 1 – 2 to the down side (red labels). “1 – 2” meaning waves 1 and 2 are complete (or nearly so), with a powerful wave 3 (up or down) to follow, essentially EWT analysts expect either a melt-up or melt-down. We know at least one group will be wrong.
The path that would make most sense (in terms of fulfilling more indicators/patterns than the other paths) is continued range racing, an eventual re-test of the February panic low (blue box), and subsequent rally to 3,000 +/- (blue labels, or scenario #2 shown in the February 28 PRR).”
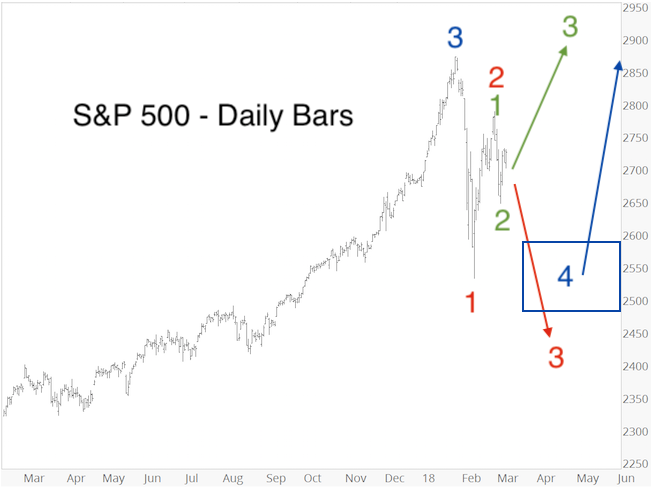
Our indicators supported the blue path weeks ago, and continue to do so (with or without another drop to 2,530 – 2,460).
However, we wanted to let subscribers know that we always monitor various developments, and if our indictors change (i.e. an increase in selling pressure or emergence of bearish divergences) we will have to adjust accordingly.
Currently we want to have some ‘skin in the game’ if stocks continue higher, but will continue to manage risk.
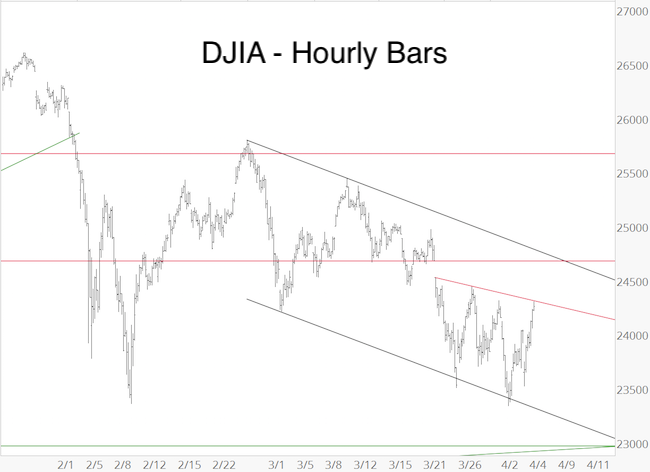
The DJIA may have finished the 5-waves lower shown in the March 28 PRR. The chart below shows some short-term resistance levels: Red line: 24,300. Trend channel: 24,700.
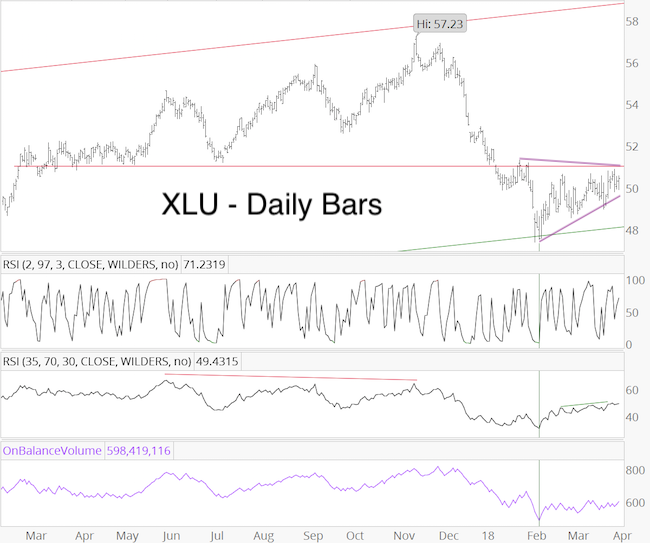
XLU continues to gnaw on resistance around 51. The pattern of this rally is not exactly bullish, but nevertheless continues to make higher highs and higher lows. RSI-35 is positive, on balance volume not (yet?). The near overbought RSI-2 condition has been digested. We will still close XLU if it moves above 51. XLU could be tracing out a messy triangle with support around 50 or 49 and resistance at 50.80 – 51. Our entry was on February 12 at 48.40.
Summary: Some bullish divergences are building, which is positive. The S&P closed today at minor resistance around 2,644. A move above 2,644, followed by 2,695 – 2,700 would increase the odds that a bottom is in.
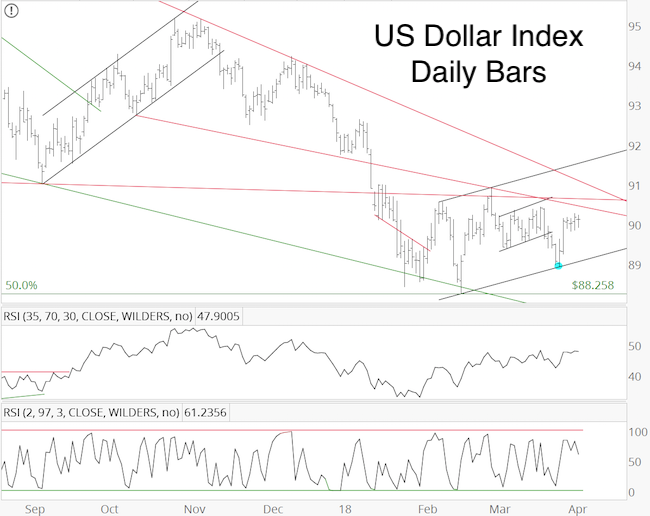
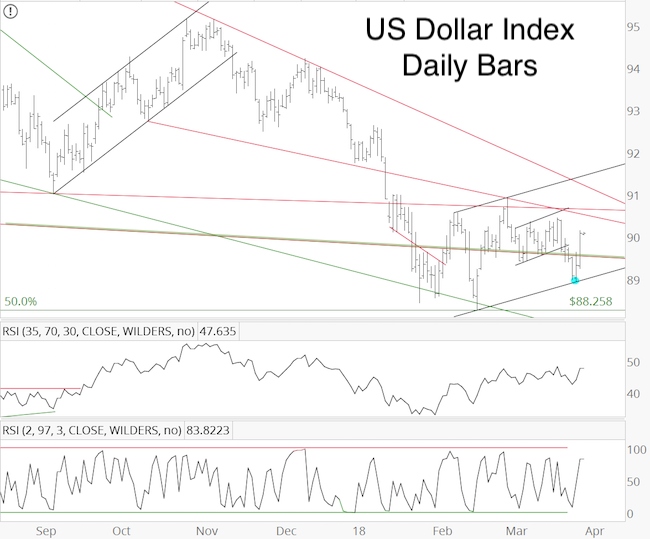
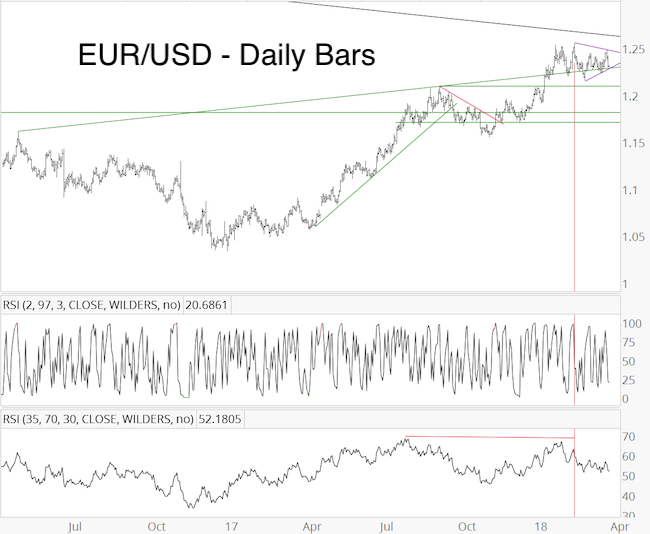
The US Dollar Index has not moved for the past 4 days. The March 27 low at 88.942 remains key. As long as trade remains above, the US dollar can continue to move higher. The EUR/USD remains still above 1.2240. A move below 1.2240 may well usher in a protracted decline.
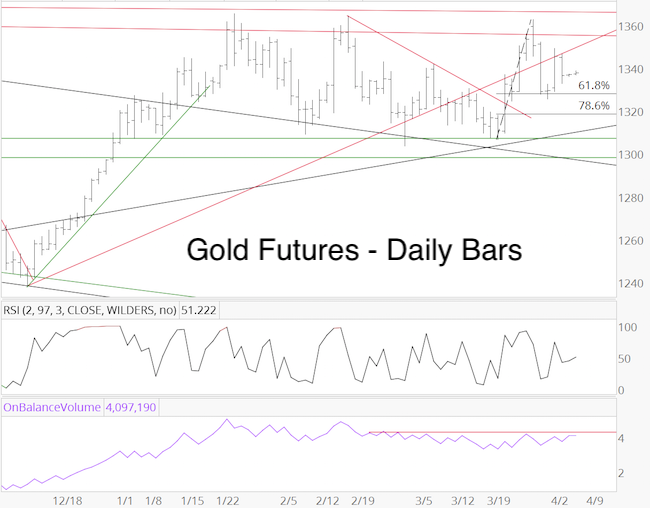
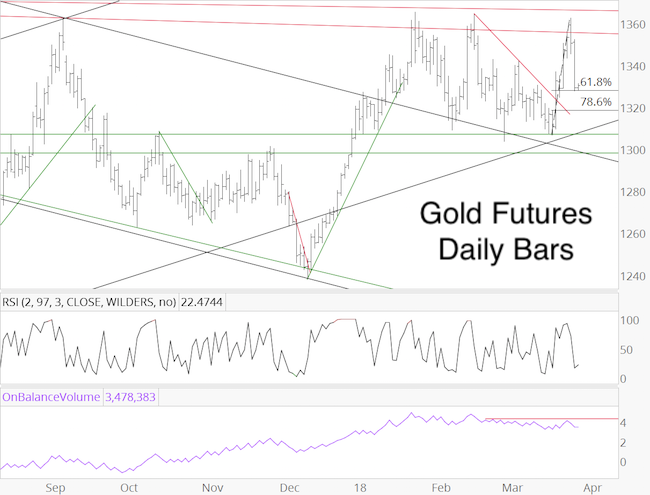
Gold bounced from the 61.8% Fibonacci support level, but that bounce has been feeble. On balance volume remains weak.
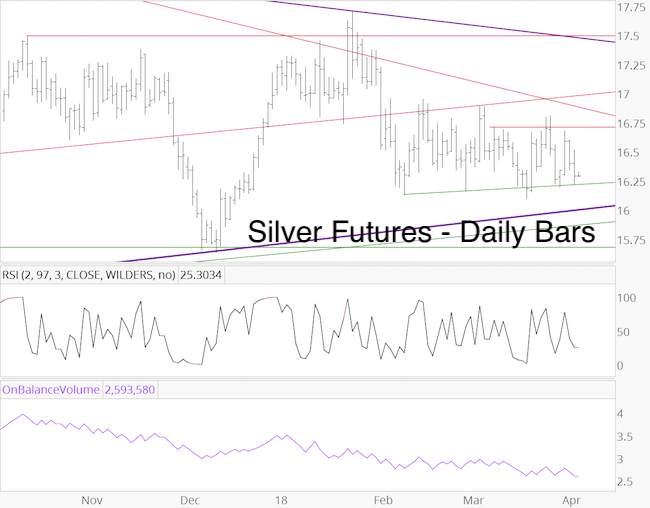
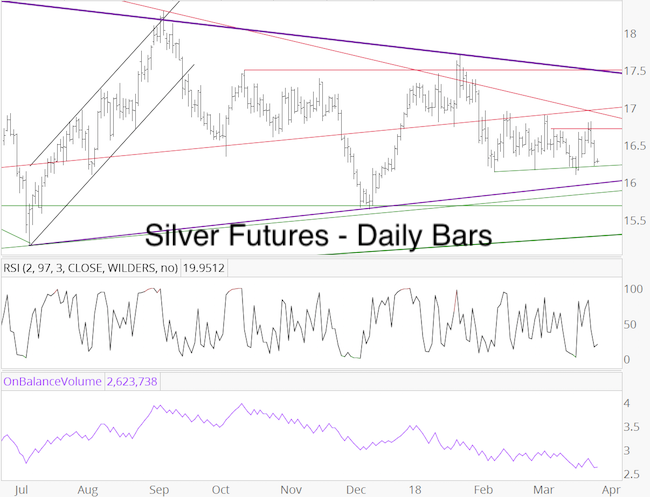
Silver is trading uninspired between support and resistance.
April 3, 2018 (10:00pm PST)
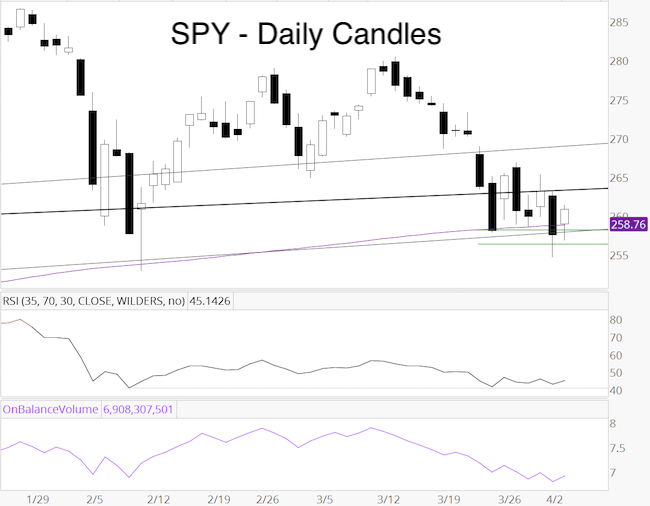
Our SPY buy order was triggered today at the open (258.87), which was above 258.10 but below 259. SPY closed 260.77, about 0.7% above our entry. The question is whether we want to limit risk and set the stop-loss at breakeven, or give SPY a longer leash.
The March 24 PRR stated: “The 200-day SMA is too popular for its own good, that’s why we rarely talk about it (aside from February 5, because it coincided with important Fibonacci support at 2,536). On February 9, the S&P 500 briefly tested the 200-day SMA, and bounced 269 points. Now the S&P is back at the 200-day SMA. It would almost be too simple if the S&P again bounces 200+ points after hitting the 200-day SMA (as it did in early February). With or without small bounce, a 200-day SMA seesaw seems more likely.”
The S&P 500 (and SPY) closed below the 200-day SMA yesterday and back above today. This seesaw stopped out a large number of 200-day SMA focused investors. We wanted to see a minimum of one seesaw, but more are possible.
Today’s rally gives us the luxury to ‘play with house money.’ Although risk of another seesaw across the 200-day SMA (which is only 0.10 points below our breakeven point) exists, our first consideration is usually safety. We will set the stop-loss for SPY at breakeven. If SPY gaps below 258.87 (S&P 500 futures are down 7 points in after hours trading), we will set the stop-loss at 256.
Investors more afraid of missing out on potential up side than being concerned with down side risk, may keep SPY without stop-loss.
April 2, 2018 (7:30pm PST)
Tonight’s PRR includes an update to the open SPY recommendation.
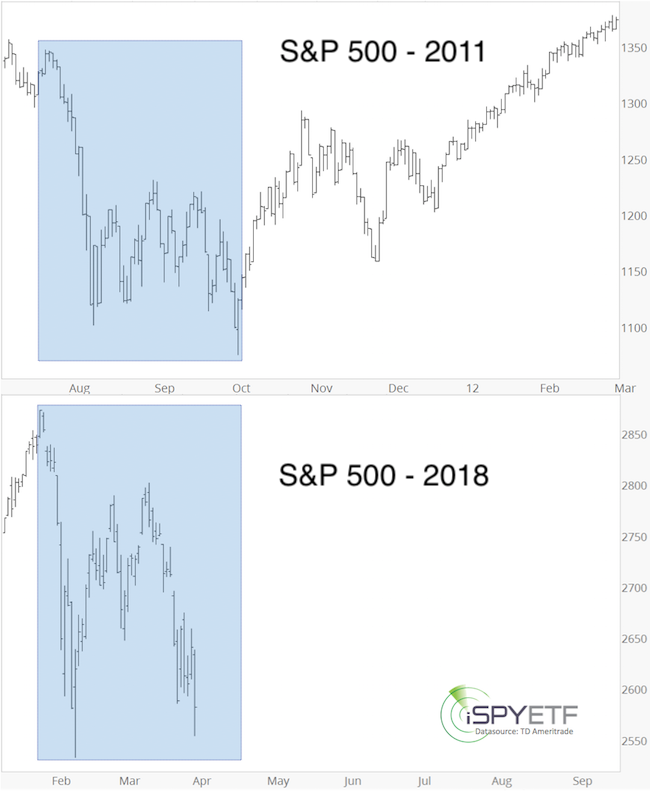
For the past 7 weeks we’ve frequently referred to our preferred, or ideal path for the S&P 500 going forward. The February 11 PRR suggested a path similar to 2011, and the February 19 PRR reiterated that: “We would like to see a retest of the panic low (W-shaped recovery) like in October 2011 or September 2015.”
The W-shaped recovery (wave 4 correction according to Elliott Wave Theory) was identical to scenario #2 outlined in the February 28 PRR or the blue path featured in the March 7 PRR.
On March 19, the wave 4 scenario (similar to 2011, or scenario #2 or blue path), which required a test of the initial February panic low at 2,533 became our primary focus (March 19, PRR: “The blue wave 4 projection (March 7 PRR) and scenario #2 (February 28 PRR) is now the preferred path.).”
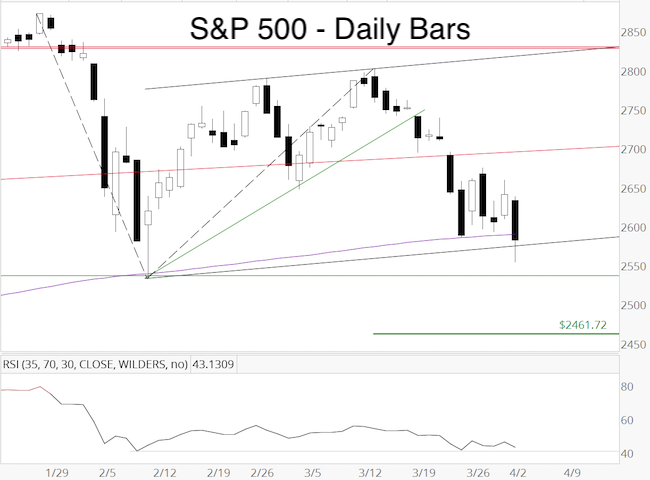
The chart below compares the 2011 correction (and subsequent rally) with the 2018 correction. Today the S&P dropped below 2,590 – 2,575 (March 28 PRR: “We would still like to see a drop below 2,590 – 2,575.”) and came within 21 points of the February panic low.
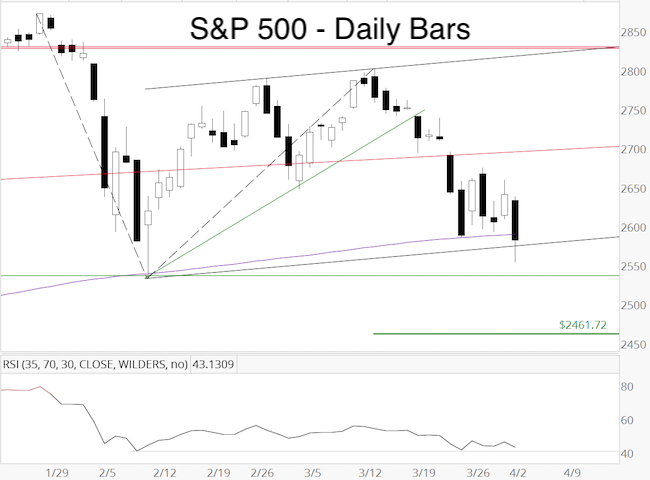
The S&P dropped below the 200-day SMA (for the first time since June 27, 2016), but closed 0.88 points above the February 9 closing low. Although RSI-35 is stronger than price, it would take a new S&P closing low to call this a bullish divergence. However, the RSI margin is so slim that an immediate S&P drop lower could erase any bullish divergence.
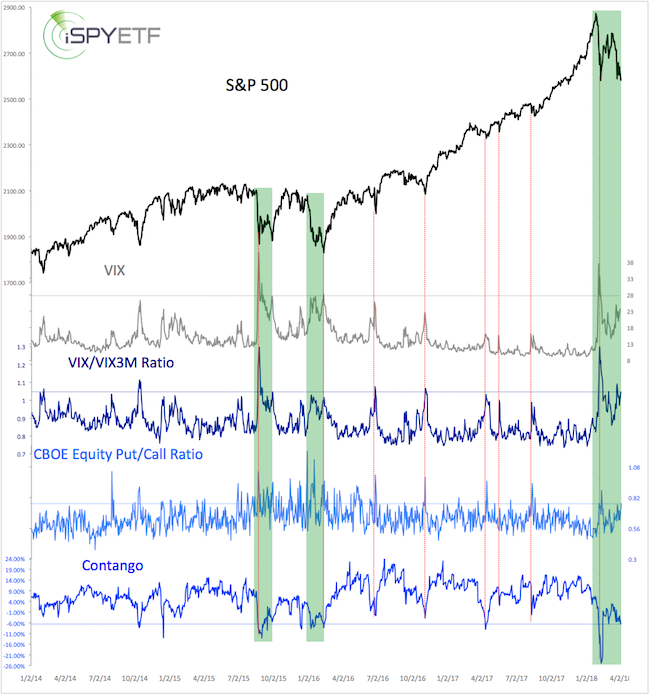
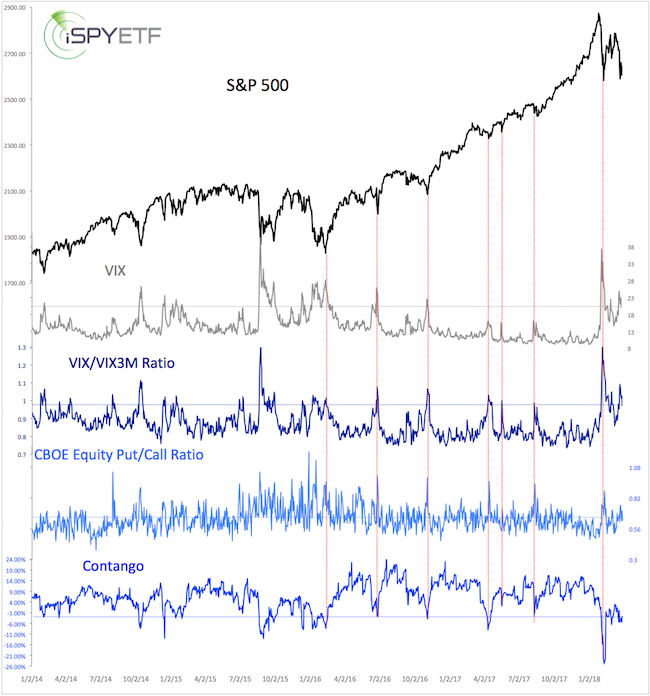
Below is an updated look at short-term sentiment extremes. All VIX-and option-based sentiment gauges had an uptick in bearishness, but not extreme. The green bars highlight the last two W-shaped corrections. Panic readings only occurred on the initial low (left W wing). The same is true this time.
80% of NYSE stocks closed the day lower, but the NY Composite a/d line is still above its February and March lows.
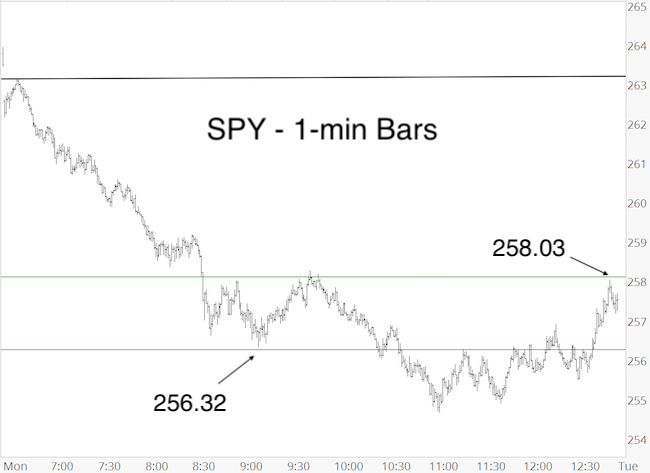
Our two-prong SPY buy recommendation required: 1) a drop below 256.25 and 2) a subsequent rally above 258.10. The chart below shows the 256.25 and 258.10 level. SPY did not meet both qualifications. The SPY buy order was not triggered. See summary section below for update SPY buy levels.
Unlike the S&P 500, SPY closed below its February low and displays a bullish RSI-35 divergence.
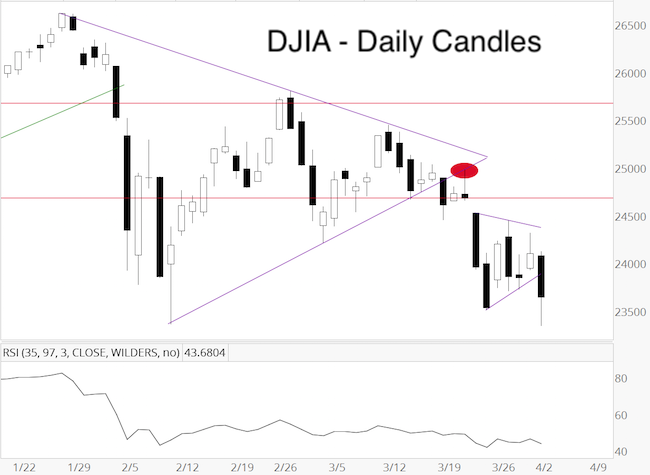
The same is true for the DJIA (new closing low, bullish divergence).
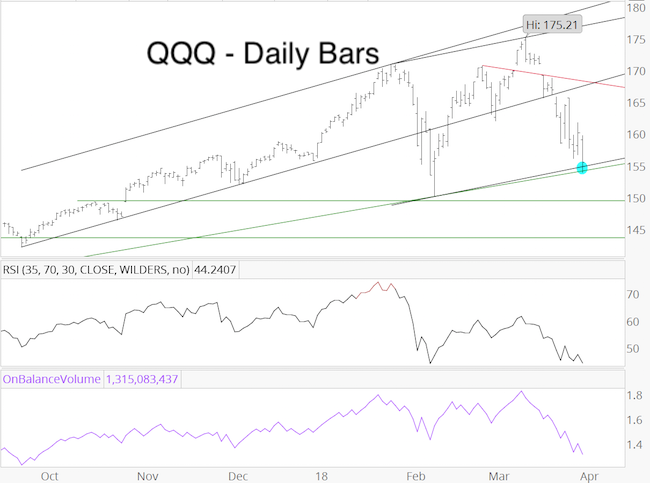
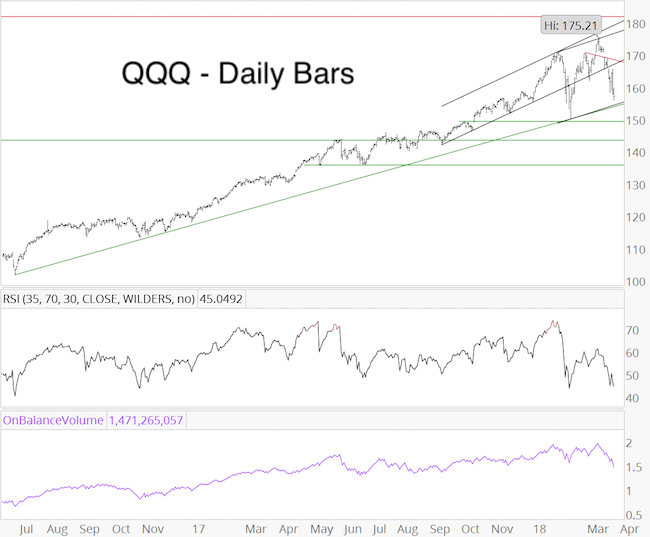
As anticipated, double support around QQQ 154.50 acted as magnet. QQQ fell as low as 153.88, but closed at 155.51. Even though QQQ remained above its February low, RSI-35 and on balance volume are at or below February level. Not bullish.
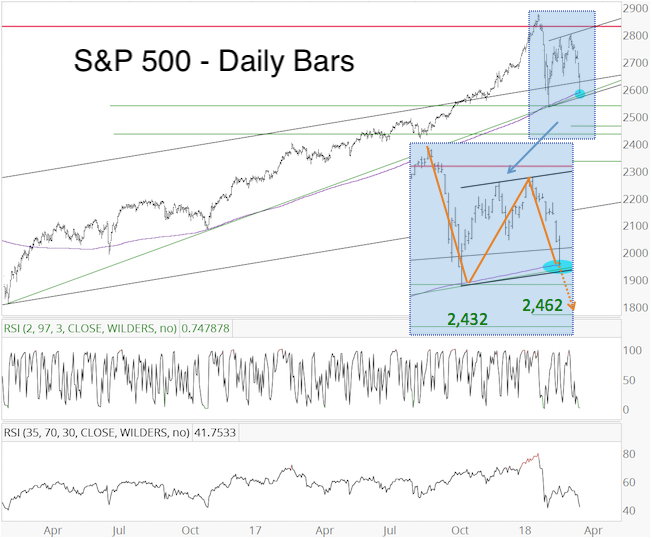
Summary: The S&P 500 has met the minimum criteria to consider this correction complete. There is, however, a difference between minimum and ideal. The ideal target is 2,530 – 2,460 (see chart below published in the March 24 PRR). S&P 500 futures are up 10 points in after hour trading. At current price, the S&P 500 would open above its 200-day SMA. SPY would gap higher an open above 258.10. It would take at least a 130-point rally to get an initial confirmation that the bottom is in. Since there is a chance the S&P won't drop into our ideal down side target, investors may need to ‘pick their poison.’
1) Be early and risk further losses
2) Be late and risk missing out on gains.
In short, the minimum target has been met, but we would prefer to see the S&P drop into and reverse in the ideal target zone (2,530 – 2,460).
We will buy SPY at the open or during the day (as long as it is above 258.10 but below 259). Our initial allocation is a conservative 5%. Our stop-loss will be at 256.
April 1, 2018 (5:30pm PST)
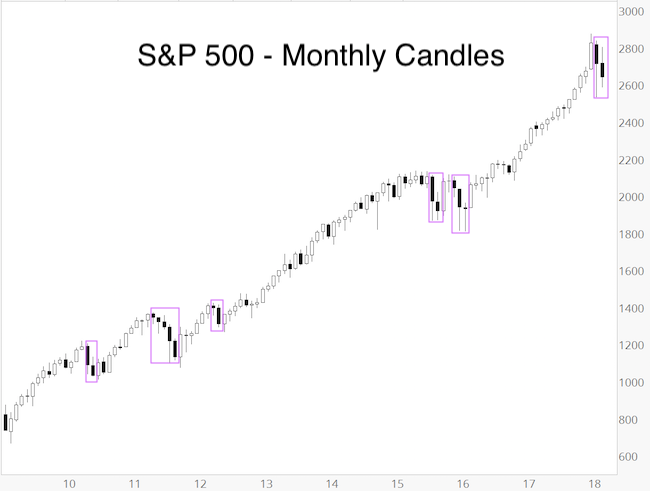
For the first time since February 2016, the S&P 500 suffered two consecutive montly red candles. Since the beginning of the 2009 bull market, the S&P recorded more than 2 consecutive red candles on 6 occasions (3 x 2 month, 1 x 3 month, 1 x 5 month, current - purple boxes). After the 3 x 2 red candles (Aug/Sep 2015, Apr/May 2012, May/Jun 2010) the S&P briefly broke below the prior low twice (Jun 2012, Jul 2010) and came within 25 points of the prior low once (Oct 2015). In February 2016 (the 1 x 3 month period), the third red candle exceeded the prior low by only 2 points.
The S&P 500 doesn't have to rhyme with prior consecutive monthly declines, but if it does, it would be in harmony with our ideal path of one more new low followed by rising prices.
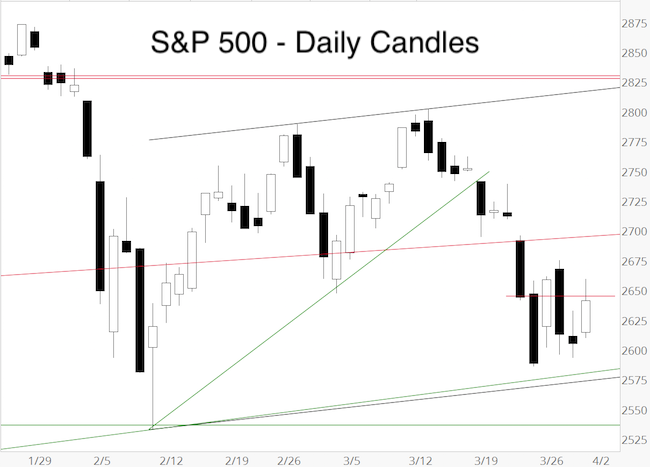
As mentioned on Wednesday, “sentiment is bearish enough to spark a bounce.” The bounce happened on Thursday, and may continue on Monday (first trading day of April has a solid bullish bias, S&P 500 up 17 of last 23 years, average gain: 0.49%).
Minor short-term resistance remains around 2,640-ish and 2,690-ish.
Below is a renewed look at our set of short-term sentiment gauges. The extremes seen around the February panic low have been digested. During double-bottoms (W-shaped corrections), investors are almost always more optimistic during the second 'W' low. That's why a new closing low (if it occurs) will probably not cause the same kind of panic seen in early February, and set up a bullish divergence.
Our New York Composite advance/decline liquidity indicator shows a similar pattern. The NYC a/d line has been trending higher (green line) and down side pressure seen in late March was less intense than in early February (in early February nearly 90% of stocks declined, in late March ‘only’ 80% of stocks declined – vertical red bars & green line).
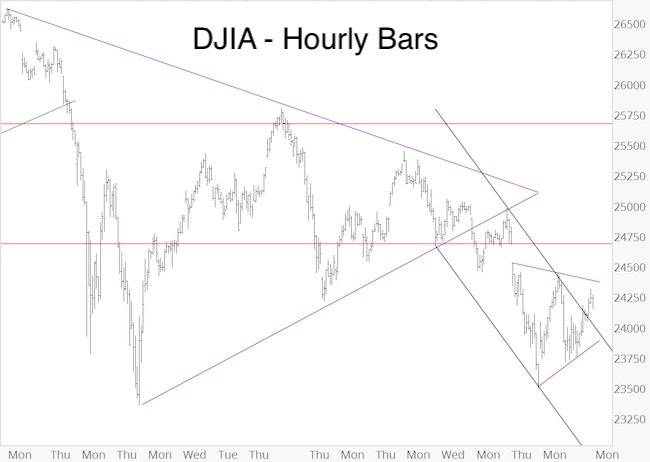
Short-term, the DJIA closed above the trend channel shown on Wednesday. As the purple lines show, DJIA could carve out a triangle (purple lines, S&P shows similar formation). This kind of micro-analysis during larger waves 4 is less reliable than at other times, but it’s about the only thing somewhat worth mentioning right now.
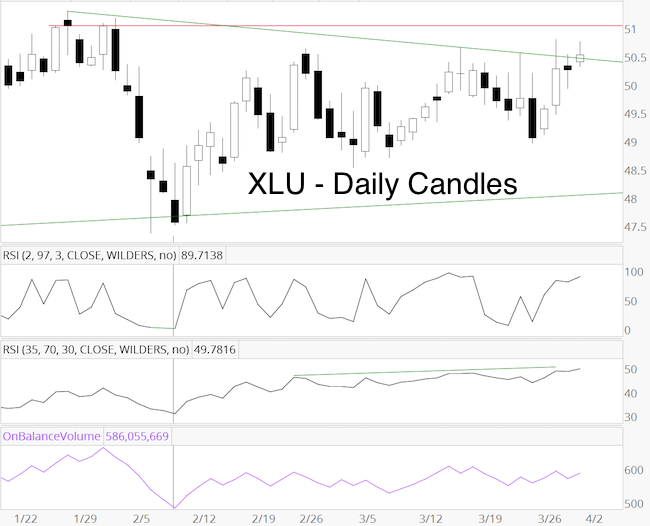
XLU closed (barely) above red trend line resistance. RSI-35 confirmed this move, on balance volume did not. RSI-2 is near overbought. Next resistance is just above 51. The positives we saw near the February low are starting to fade a bit, and XLU will have to overcome 51 to unlock further upside. If XLU rallies to 51 on Monday/Tuesday, RSI-2 will likely be fully overbought. We will lock in gains and sell XLU if it spikes above 51.
Summary: Short-term sentiment and money flow (liquidity) suggest that fear and selling pressure are improving, setting the stage for bullish divergences. For a true bullish divergence, we would have to see a new S&P 500 closing low, which is what we’re waiting for to confirm our ideal path for a more significant bottom.
Although we are looking to buy, our indicators and cycles do not project massive up side, even once a low is in place.
The EUR/USD, US Dollar Index, gold and silver did not move much since Wednesday’s PRR.
March 28, 2018 (6:10pm PST)
The market will be closed on Friday in observance of Good Friday. The next update will be published as usual on Sunday.
The week started with a massive rally (Monday) and was followed by an even bigger drop (Tuesday). Normally pops and drops like Monday/Tuesday would validate a special PRR, but considering the larger context (March 19 PRR: “Waves 4 cause a lot of whipsaw and require patience. There may well be times where it will feel like we missed an opportunity ... just before stocks reverse and offer a second [or even third] chance.”) it’s sometimes best not to over-analyze certain moves.
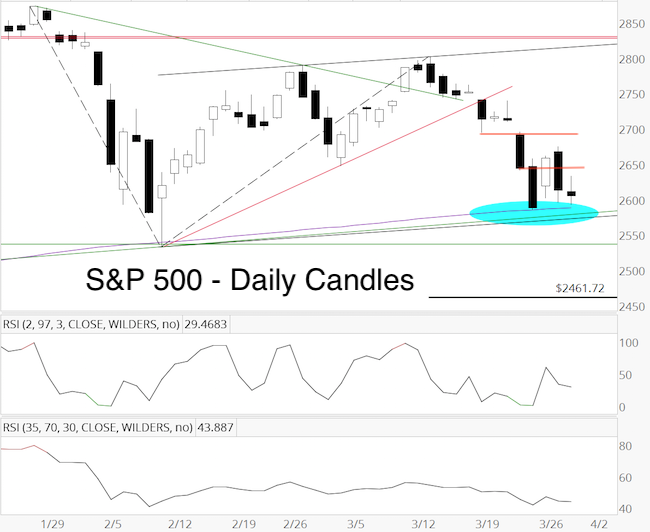
The S&P 500 is stomping around atop the blue support cluster at 2,590 – 2,570. We would still like to see a drop below 2,590 – 2,575 (ideally to around 2,530 or 2,460), but short-term sentiment is bearish enough to spark a bounce.
Pinpointing resistance levels in a wave 4 environment tends to be a fools errand, but 2,645-ish and 2,690-ish may be worth watching. A move above 2,645-ish could lead to 2,690-ish, but such a bounce would not eliminate the potential for a drop below 2,590.
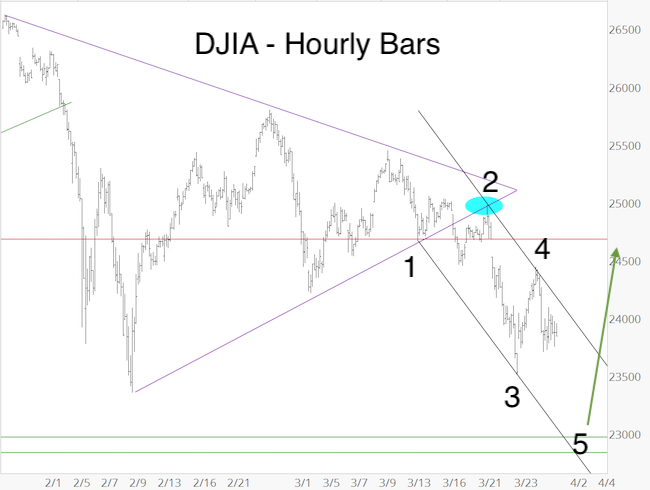
The hourly DJIA chart below outlines a short-term trend channel and potential short-term Elliott Wave Theory count. If that’s correct, DJIA should drop below 23,360, find support (ideally at 23,000 – 22,800) and rally.
Double Nasdaq-100 QQQ support around 154.50 could act as magnet and reversal target. At this point, there is no bullish divergence as RSI-35 is toying with new lows (even though QQQ remains above its February low) and on balance volume is already at new lows.
Summary: This is a difficult environment to trade, which is why we trade only if the S&P follows our ideal path (drop below 2,590 at minimum, followed by a rally). The current constellation of various indicators suggests that carving out a low may be a process that could take a few more days, even weeks. For now we will keep our SPY buy recommendation open.
We will take another close look at investor sentiment and money flow in Sunday’s PRR.
As anticipated, the US Dollar Index tested trend channel support at 88.90 (blue oval). From there it rallied strongly. Yesterday’s low (blue oval) could be important and can be used as a stop-loss level for long positions (like UUP). We may soon be adding to our existing UUP position.
Short-term, the EUR/USD allows for a triangle (purple lines), with a potential bullish breakout. This doesn’t have to happen, but it could. If it does, it would likely lead to a test of the long-term trend channel at 1.2620 (black line) and a great opportunity to short the euro (long dollar). A break below 1.2240 would very likely mean that a EUR/USD top (and dollar bottom) is in and signal a longer-term trend reversal.
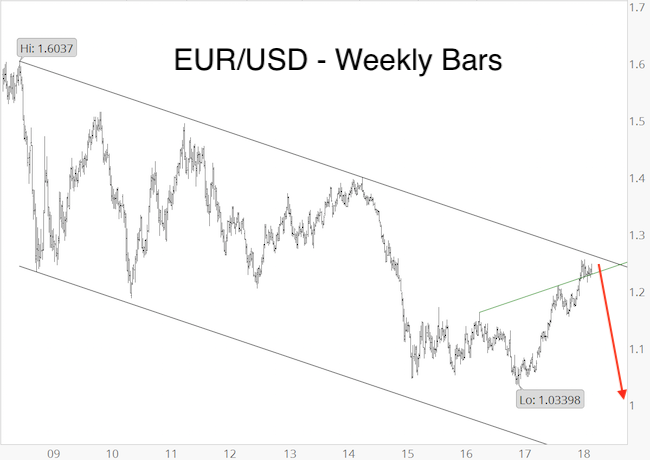
Long-term, the EUR/USD shows a bearish RSI divergence, is close to long-term trend channel resistance, with cycles soon turning lower, and sentiment supporting falling euro prices.
Gold validated our suspicion and fell hard, retracing almost exactly 61.8% of the March 20 – 27 rally. If gold started a rally with a target north of 1,382 (wave 3 up next?), it should stay above Fibonacci support at 1,328 or 1,318. For aggressive traders, this is a low-risk opportunity to go long with a stop-loss just below support.
Of course, a strong gold rally is unlikely if the US Dollar Index is also about to rally.
Silver is once again back at support around 16.2.
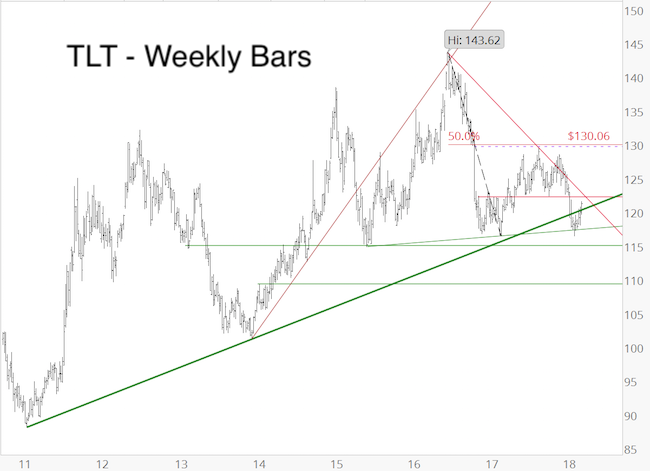
This is a follow up to the 30-year Treasuries analysis published on March 14 PRR.
TLT closed above the bold (previously red, now) green trend line. According to Elliott Wave Theory, TLT can still relapse to a new low. However, a move above 122.42 as good as eliminates this bearish option. Cycles are pointing higher. In short, the trend is higher as long as TLT stays above ascending trend line support (120.40) and once TLT clears 122.42.
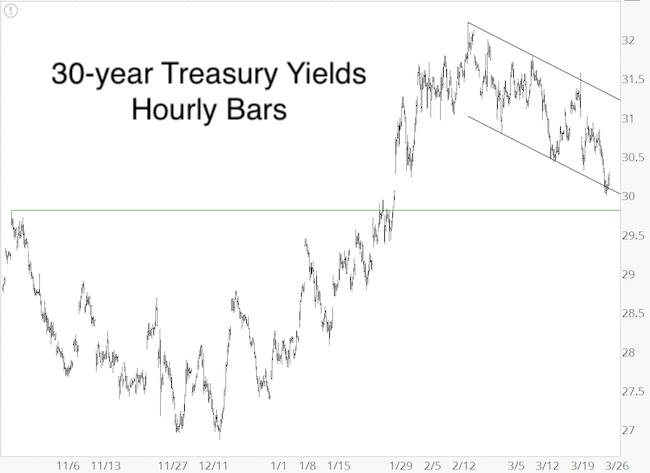
Below is an updated look at the 30-year Treasury Yield trend channel shown on March 14. Since then there’ve been two more trend channel touch points. A sustain yield break below 3% (based on trend channel) and 2.98% (based on Elliott Wave Theory) will point to lower yields/higher prices.
Continued updates and analysis is available via the Profit Radar Report.
Simon Maierhofer is the founder of iSPYETF and the publisher of the Profit Radar Report. Barron's rated iSPYETF as a "trader with a good track record" (click here for Barron's profile of the Profit Radar Report). The Profit Radar Report presents complex market analysis (S&P 500, Dow Jones, gold, silver, euro and bonds) in an easy format. Technical analysis, sentiment indicators, seasonal patterns and common sense are all wrapped up into two or more easy-to-read weekly updates. All Profit Radar Report recommendations resulted in a 59.51% net gain in 2013, 17.59% in 2014, and 24.52% in 2015.
Follow Simon on Twitter @ iSPYETF or sign up for the FREE iSPYETF Newsletter to get actionable ETF trade ideas delivered for free.
If you enjoy quality, hand-crafted research, >> Sign up for the FREE iSPYETF Newsletter
|