What caused the February meltdown? If you are looking for another strong opinion, sorry, you won’t find it here.
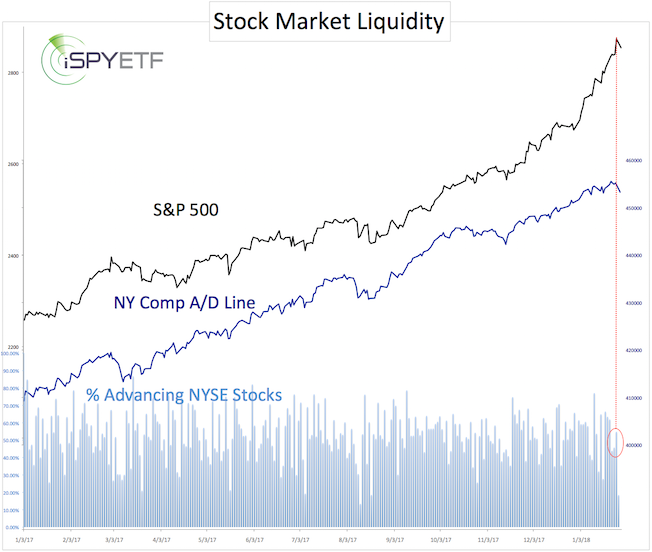
Before we address the more important issue – whether now is the time to buy or sell – here is one tell-tale sign (of what contributed to the 'meltdown') brought out by the January 29 Profit Radar Report.
“On Friday, the S&P 500 jumped more than 1% to a new all-time high with less than 55% of stocks advancing, another one of those unusual events. The only other times this happened was once in 1987 and thrice in 1999. All four events were followed by minor 2-8% immediate corrections, and eventually big corrections and bear markets.”
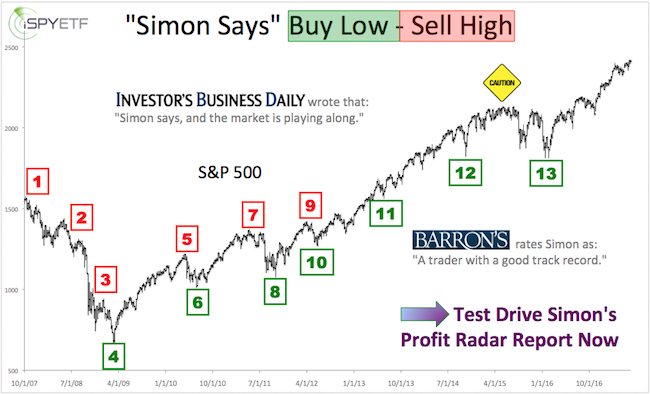
Barron's rates iSPYETF as "trader with a good track record" and Investor's Business Daily says: "When Simon says, the market listens." Find out why Barron's and IBD endorse Simon Maierhofer's Profit Radar Report.

The correction sure was immediate, and it didn’t stop at 2-8%.
Buy or Sell?
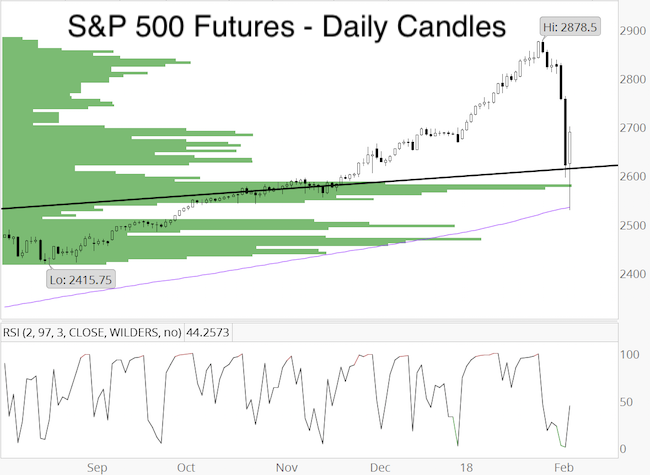
Since much of the recent market action happened overnight, we’ll first be looking at the S&P 500 futures chart, which includes overnight trading activity.
The February 5 and 6 Profit Radar Reports published the chart below and stated: “Based on the extremely oversold readings, a bounce is becoming highly likely. S&P 500 futures tested the 200-day SMA and 38.2% Fibonacci. From high to low, the S&P 500 futures lost 12.14%. This is already more than the 5-10% correction we anticipated and close to the 14.38% loss (on average based on the last 4 cycles) leading into the mid-term low (see 2018 S&P 500 Forecast).”

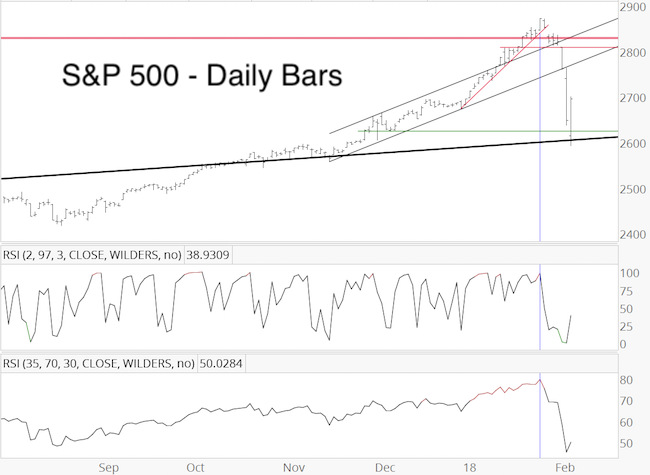
The S&P 500 cash index looks a little different, as the pullback was ‘only’ 9.74%.
Here is one reason why we expect eventual all-time highs: RSI-2 was overbought, which suggested risk, but RSI-35 confirmed the January 26 all-time high.
If you enjoy quality, hand-crafted research, >> Sign up for the FREE iSPYETF Newsletter
RSI-35 also confirmed the December 2016 and March 2017 highs. As we mentioned many times in recent years, stocks rarely ever carve out a major top at peek momentum.

Conclusion
This clearly is a market that plays by its own rules (the rules are: there are no rules). Nevertheless, nearly all our studies and indicators suggest a resumption of the bull market once this correction is over.
S&P 500 futures already met our down side target, the S&P 500 cash index not yet. Ideally we’ll see a test of the panic low with a bullish divergence for a higher probability buy signal.
Either way, we consider this a buy the dip market. Continued updates and trade recommendation are available via the Profit Radar Report.
Simon Maierhofer is the founder of iSPYETF and the publisher of the Profit Radar Report. Barron's rated iSPYETF as a "trader with a good track record" (click here for Barron's profile of the Profit Radar Report). The Profit Radar Report presents complex market analysis (S&P 500, Dow Jones, gold, silver, euro and bonds) in an easy format. Technical analysis, sentiment indicators, seasonal patterns and common sense are all wrapped up into two or more easy-to-read weekly updates. All Profit Radar Report recommendations resulted in a 59.51% net gain in 2013, 17.59% in 2014, and 24.52% in 2015.
Follow Simon on Twitter @ iSPYETF or sign up for the FREE iSPYETF Newsletter to get actionable ETF trade ideas delivered for free.

If you enjoy quality, hand-crafted research, >> Sign up for the FREE iSPYETF Newsletter
|