I don’t like to dignify bad behavior. That’s probably why I’ve only written about the fiscal spectacle once before (December 7: Will the Fiscal Cliff Really Send Stocks Spiraling?).
Stocks rallied strongly on news that Congress approved a quick fix that buys a little more time. Will the S&P 500 and SPY ETF even go as far as reward politicians’ shenanigans with new recovery highs?
Confession Time
I have to admit that we didn’t get to profit (at least not much) from this week’s explosion to the up side. That’s not because it wasn’t expected.
The December 23 Profit Radar Report wrote that: “The decline from September 14 – November 16 was a correction on the S&P’s journey to new recovery highs. This scenario is supported by the lack of bearish price/RSI divergences at the September 14 high, continuous QE liquidity and bullish seasonality.”
The same update also warned that: “the S&P is littered with resistance levels from 1,417 – 1,440. This suggests that any immediate up side may be choppy.”
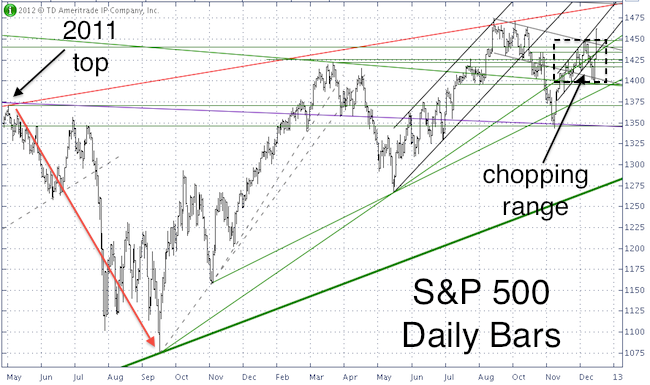
In fact, the up side was so choppy that it diluted many support/resistance levels and made it tricky to find a low-risk buying level. The chart below (it looks busy, that’s why there was no low-risk entry) highlights the support/resistance levels rendered nearly useless by 5 weeks of zig zagging back and forth.

This is frustrating, but crying over spilled milk is of no benefit. There will always be another trade set up, in fact a huge setup is in the making right now.
Wednesday’s move above 1,448 unlocked a number of temporarily bullish options. The up side from here is probably going to be choppy and limited, but should lead to the best low-risk sell signal in well over a year.
I am using a little-known but effective strategy to project the target (and reversal zone) for the current rally. Effective because the strategy is a mirror image of the strategy I used to pinpoint the April 2011 high (at S&P 1,365), which led to a 300-point free fall.
This strategy suggests a new recovery high followed by a major top. I don’t know if the reversal will be as significant or more significant than the one in April 2011, but investing is a game of probabilities. The odds for a low-risk entry just don’t get much better than this.
The latest Profit Radar Report reveals the little known strategy used to project the target for this rally along with the actual target level for a potentially epic reversal.
|