According to Barron’s, the VIX is flashing a stock market warning. Barron’s is not alone. If you threw a water balloon in a room filled with analysts, odds are you’ll hit someone who's bearish stocks because of the VIX.
Facts Trump Opinions
VIX readings below 10 are rare. There’ve only been 9 other ones since the VIX’s inception in 1993. None of them led to stock market crashes (click here for detailed analysis).
Some claim that the 2000 and 2007 market tops were preceded by a low VIX, but that’s one of the biggest misconceptions on Wall Street.
This special report, published by the Profit Radar Report on June 16, 2014, showed why the VIX was TOO LOW for a major market top back then (and still is today).
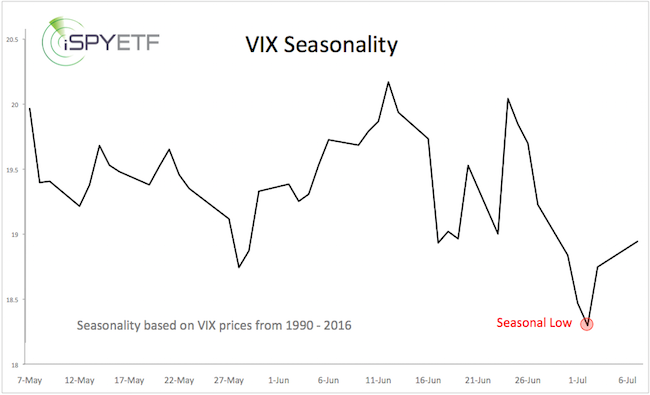
VIX Seasonality
VIX seasonality supports overall lower readings until the major seasonal low in early July.
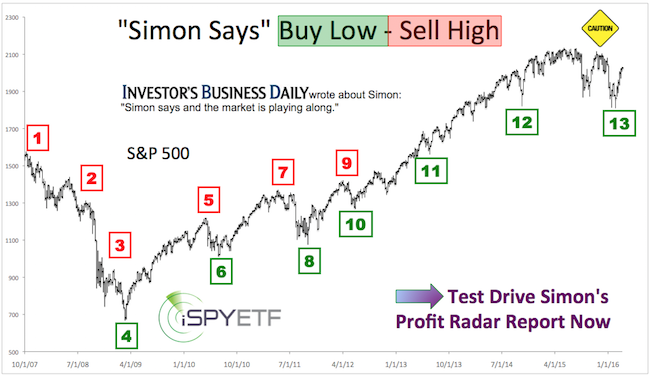
Barron's rates iSPYETF as "trader with a good track record" and Investor's Bussines Daily says "When Simon says, the market listens." Find out why Barron's and IBD endorse Simon Maierhofer's Profit Radar Report.

VIX-based Indicators
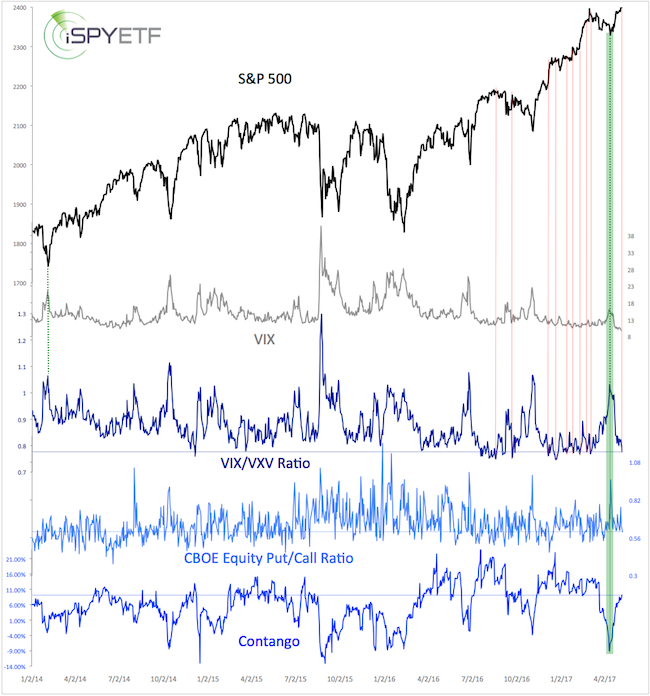
The chart below plots the S&P 500 against the VIX, VIX/VXV ratio, CBOE equity put/call ratio, and contango.
If you enjoy quality, hand-crafted research, >> Sign up for the FREE iSPYETF Newsletter

The VIX/VXV ratio gauges fear of short-term volatility (30-day, VIX) compared to longer-term volatility (90-days, VXV). Readings above 1 happen when investors are more concerned about the short-term than longer-term.
This occurs near stock market lows and has been a very reliable buy signal. The April 16 Profit Radar Report noted the VIX-sell signal highlighted in green (VIX is down 39% since).
On Monday, the VIX/VXV ratio was 0.776. Readings below 0.76 happen when investors are more concerned about the longer-term than the short-term.
Although a potential warning sign, the VIX buy signal (<0.77) has not been as accurate as the VIX sell signal (>1.0).
The CBOE equity put/call ratio and contango are showing a measure of bearish (for stocks) potential, but have plenty room to become more extreme.
S&P 500 Outlook
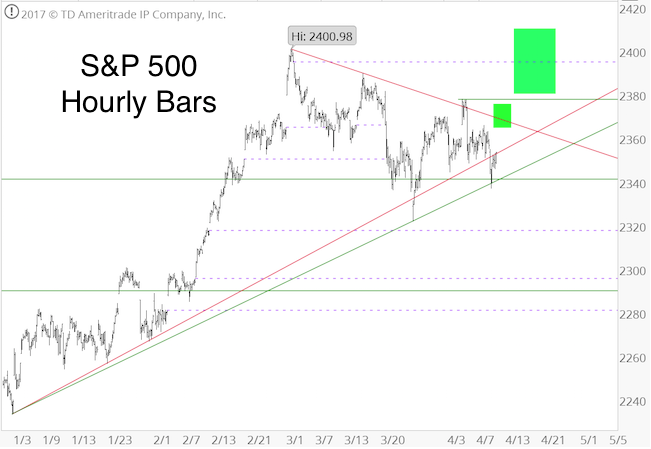
The April 11 Profit Radar Report published the chart below along with the following forecast: “As long as trade remains above 2,330, we are still looking for higher prices. The chart below outlines two potential up side targets (2,365 – 2,375 and 2,380 – 2,410).” The upside target was revised to 2,405 – 2,410 on April 26 (more detailed outlook available here).

The S&P is now just below 2,410. It remains to be seen whether bears will take a stand, but if they do, it should be around 2,410 (which would result in a VIX spike).
Continued analysis for the S&P 500, VIX and other asset classes is available via the Profit Radar Report.
Simon Maierhofer is the founder of iSPYETF and the publisher of the Profit Radar Report. Barron's rated iSPYETF as a "trader with a good track record" (click here for Barron's profile of the Profit Radar Report). The Profit Radar Report presents complex market analysis (S&P 500, Dow Jones, gold, silver, euro and bonds) in an easy format. Technical analysis, sentiment indicators, seasonal patterns and common sense are all wrapped up into two or more easy-to-read weekly updates. All Profit Radar Report recommendations resulted in a 59.51% net gain in 2013, 17.59% in 2014, and 24.52% in 2015.
Follow Simon on Twitter @ iSPYETF or sign up for the FREE iSPYETF Newsletter to get actionable ETF trade ideas delivered for free.

If you enjoy quality, hand-crafted research, >> Sign up for the FREE iSPYETF Newsletter
|