Tunnel vision is almost always a risky approach to investing, however, this is one of those rare times where tunnel vision is actually the best way to go.
With tunnel vision I mean focusing on the (only) indicator that’s been working, and tuning out all other indicators.
Elliott Wave Theory (EWT) has been the indicator deserving of investors' focus. EWT (interpreted correctly) has persistently pointed to higher prices.
Months before the Trump rally, EWT strongly suggested a S&P 500 rally into the mid 2,300s and higher (original price projection was published here: S&P 500 Update – Expect the Abnormal).
Barron's rates iSPYETF as "trader with a good track record" and Investor's Bussines Daily says "When Simon says, the market listens." Find out why Barron's and IBD endorse Simon Maierhofer's Profit Radar Report.
Short-term Outlook
The December 14, 2016 Profit Radar Report expected a prolonged period of sideways trading, and after over a month of ‘go nowhere’ action, the January 29 Profit Radar Report stated that:
“The sideways trading since Wednesday looks to be wave 4 with a possible down side target of 2,280 – 2,290 (open gap at 2,284.63). Based on the bearish divergences the S&P may peel lower, but based on EWT there’s a good chance the S&P will find support in the 2,280 – 2,290 range and rally into the low-mid 2,300s.”
If you enjoy quality, hand-crafted research, >> Sign up for the FREE iSPYETF Newsletter
We now know that EWT prevailed over bearish divergences and rallied into the EWT-based up side target mentioned in February 5 Profit Radar Report:
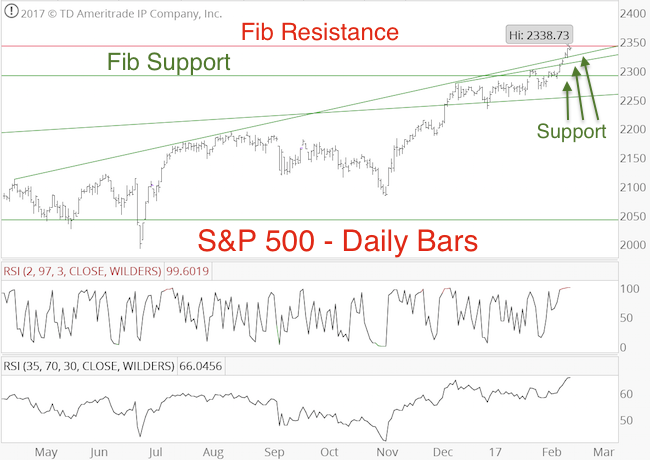
“The S&P 500 moved above 2,290 on Friday. Measured EWT-based up side targets are in the 2,320 – 2,370 zone. Various bearish divergences (RSI-35, stocks above 50-day SMA) and near oversold condition still suggest some caution.”
No Can Do Tunnel Vision
To maintain a diversified research and forecasting approach, the Profit Radar Report looks at the most potent indicators and never relies solely on any one indicator.

Today's push to new all-time highs erased (almost) all larger bearish divergences, and synchronizes EWT more with many other indicators (only cycles are short-term bearish).
The weight of evidence points to more strength ahead (2 steps forward, 1 step back, as outlined by the January 4 Profit Radar Report). Any pauses caused by overbought conditions or investors sentiment should be short-term in nature.
Next resistance (and chance for a pullback/pause) is around 2,342. Support is at 2,320, 2,300 and 2,285 (see chart).
At some point in 2017 however, we should see either a major market top or a 15% correction. More detail is available in the multiple-indicator based 2017 S&P 500 Forecast.
Popular S&P 500 ETFs include:
-
SPDR S&P 500 ETF (SPY)
-
iShares S&P 500 ETF (IVV)
-
Vanguard S&P 500 ETF (VOO)
Simon Maierhofer is the founder of iSPYETF and the publisher of the Profit Radar Report. Barron's rated iSPYETF as a "trader with a good track record" (click here for Barron's profile of the Profit Radar Report). The Profit Radar Report presents complex market analysis (S&P 500, Dow Jones, gold, silver, euro and bonds) in an easy format. Technical analysis, sentiment indicators, seasonal patterns and common sense are all wrapped up into two or more easy-to-read weekly updates. All Profit Radar Report recommendations resulted in a 59.51% net gain in 2013, 17.59% in 2014, and 24.52% in 2015.
Follow Simon on Twitter @ iSPYETF or sign up for the FREE iSPYETF Newsletter to get actionable ETF trade ideas delivered for free.

If you enjoy quality, hand-crafted research, >> Sign up for the FREE iSPYETF Newsletter
|