Although volatile, 2016 was a good year for crude oil. The January 10, 2016 Profit Radar Report printed this outlook for 2016:
“Sentiment is bearish (which should be positive for oil), but seasonality has a minor weak spot until early February. The overall setup for oil in 2016 looks positive, with a potential buy signal early February.”
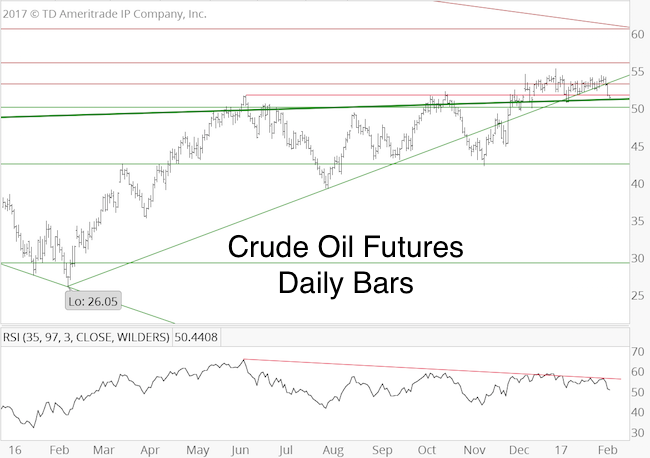
Crude oil bottomed on February 11 at 26.05.
Barron's rates iSPYETF as "trader with a good track record" and Investor's Bussines Daily says "When Simon says, the market listens." Find out why Barron's and IBD endorse Simon Maierhofer's Profit Radar Report.
For the second half of 2016 our indicators never really lined up to point in the same direction. There was no clear signal, which helps explains the choppy performance since the June high.

What are key indicators projecting for 2017?
Investor Sentiment
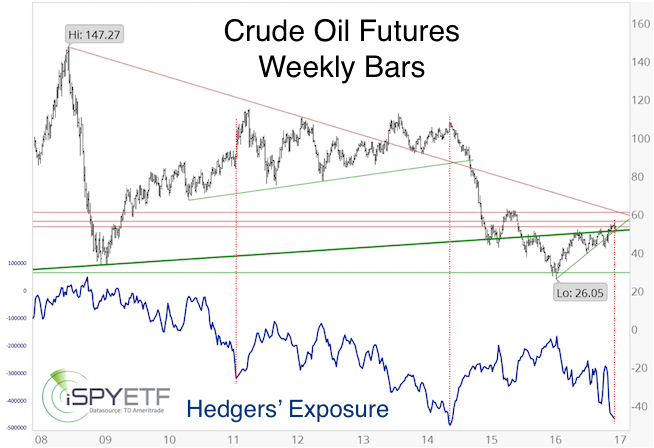
Commercial hedgers (the smart money) are betting on lower oil prices. In fact, hedgers are holding a record amount of short exposure.
The chart below was published in the January 11, 2017 Profit Radar Report. At the time, hedgers were short to the tune of 465,400 futures contracts (this has increased to 509, 138).

Nevertheless, the January 11, 2017 Profit Radar Report stated that: “As long as trade stays above 48 – 50, we will allow for higher prices.” Why?
If you enjoy quality, hand-crafted research, >> Sign up for the FREE iSPYETF Newsletter
Seasonality
Oil is one of those commodities with a very distinct seasonal pattern. Seasonality turns strongly bullish in February.
Tiebreaker: Technical Analysis
Investor sentiment suggests risk is rising while seasonality should buoy prices.
How do we reconcile this conflict between sentiment and seasonality?
Such conflicts often cause stalemates or relative trading ranges.
Based on Elliott Wave Theory, oil appears to be in a wave 4 rally (which retraces part of the 2014 – 2016 drop from 107 to 26.
Ideally wave 4 will extend higher (towards 60) before falling towards and below 26 in wave 5.
Here are the most liquid oil ETPs (Exchange Traded Products):
United States Oil Fund (USO)
iPath S&P GSCI Crude Oil ETN (OIL)
ProShares UltraShort Bloomberg Crude Oil ETF (SCO)
VelocityShares 3x Inverse Crude Oil ETN (DWTI)
Continued updates and trade recommendations will be available via the Profit Radar Report.
Simon Maierhofer is the founder of iSPYETF and the publisher of the Profit Radar Report. Barron's rated iSPYETF as a "trader with a good track record" (click here for Barron's profile of the Profit Radar Report). The Profit Radar Report presents complex market analysis (S&P 500, Dow Jones, gold, silver, euro and bonds) in an easy format. Technical analysis, sentiment indicators, seasonal patterns and common sense are all wrapped up into two or more easy-to-read weekly updates. All Profit Radar Report recommendations resulted in a 59.51% net gain in 2013, 17.59% in 2014, and 24.52% in 2015.
Follow Simon on Twitter @ iSPYETF or sign up for the FREE iSPYETF Newsletter to get actionable ETF trade ideas delivered for free.

If you enjoy quality, hand-crafted research, >> Sign up for the FREE iSPYETF Newsletter
|