Although we are longer-term bullish, we expected lower prices prior to a buying opportunity. The last S&P 500 update highlighted lacking up side momentum and bearish divergences … which caught up with stocks this week.
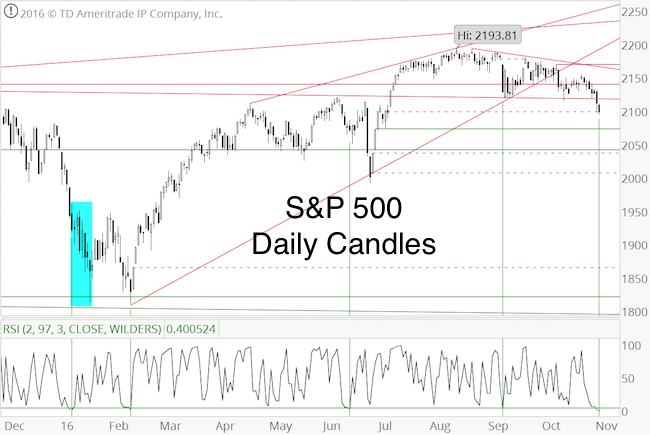
The Profit Radar Report has been anticipating a ‘flush out’ move below obvious support at 2,120 and stated on October 30 that: “The next possible target for a low is 2,100.”
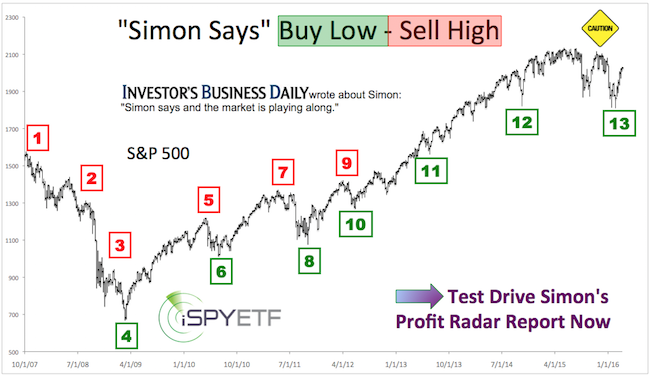
Barron's rates iSPYETF as "trader with a good track record" and Investor's Bussines Daily says "When Simon says, the market listens." Find out why Barron's and IBD endorse Simon Maierhofer's Profit Radar Report.
Why 2,100? An open chart gap at 2,098.70 has been waiting to get filled (dashed purple line).

The October 30 Profit Radar Report stated that: “The preferred scenario would be a quick (perhaps even intraday) washout (to 2,100) that flushes out weak hands and clears the air for a more sustainable rally.”
The emphasis is on quick. On Wednesday the S&P failed to build on the initial recovery from Monday’s lows (right after the open chart gap was closed). While the S&P maintains below resistance (prior support), it's at risk to fall further.
As green lines in the first chart show, the S&P 500 is oversold (based on RSI-2). Oversold conditions have led to bounces 3 out of 4 times in 2016 (the one failure is highlighted in blue).
Oversold and Overhated
The market is not only oversold, it is also overhated.
If you enjoy quality, hand-crafted research, >> Sign up for the FREE iSPYETF Newsletter
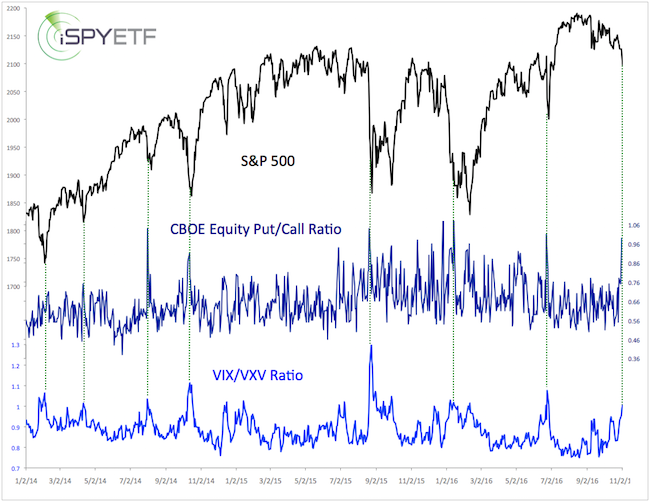
The second chart shows that various sentiment metrics are nearing noteable extremes.

VIX traders believe that longer-term volatility (90 days, VXV) will be higher than shorter-term volatility (30 days, VIX). The VIX/VXV ratio is above 1 for the first time since the Brexit vote.
Also for the first time since the Brexit vote, option traders are nearly buying as many puts as calls The CBOE put/call ratio is one of the highest we’ve seen in the past few years.
Opportunities are Born in Panic
History says that the best opportunities are born in times of panic. Where is maximum panic?
In January the S&P continued temporarily lower despite being oversold and overhated, but eventually rebounded strongly. The more panic, the better the opportunity.
It’s risky to short such a market, and much more promising to look for a low-risk buying opportunity.
The Profit Radar Report nailed the February low (buy recommendation at S&P 1,828 on February 11) and we will try to do the same for the up coming low.
Our focus in the coming days/weeks will be to minimize short-term down side risk without missing the lowest possible entry point to buy.
Continued S&P 500 updates and buy/sell recommendations are available via the Profit Radar Report.
Simon Maierhofer is the founder of iSPYETF and the publisher of the Profit Radar Report. Barron's rated iSPYETF as a "trader with a good track record" (click here for Barron's profile of the Profit Radar Report). The Profit Radar Report presents complex market analysis (S&P 500, Dow Jones, gold, silver, euro and bonds) in an easy format. Technical analysis, sentiment indicators, seasonal patterns and common sense are all wrapped up into two or more easy-to-read weekly updates. All Profit Radar Report recommendations resulted in a 59.51% net gain in 2013, 17.59% in 2014, and 24.52% in 2015.
Follow Simon on Twitter @ iSPYETF or sign up for the FREE iSPYETF Newsletter to get actionable ETF trade ideas delivered for free.

If you enjoy quality, hand-crafted research, >> Sign up for the FREE iSPYETF Newsletter
|