The last S&P 500 updates highlighted support around 2,040 and why the S&P is likely to seesaw across this support to fool investors (S&P 500 Abuses Popular Pattern to Fool Investors).
Following the faux break below 2,040, the May 22 Profit Radar Report observed that: “Stocks delivered the fakeout move we anticipated. The recovery from Thursday's low was strong enough to lead to further gains. A move beyond 2,066 could lead to 2,085+/-.”
Barron's rates the iSPYETF as a "trader with a good track record." Click here for Barron's assessment of the Profit Radar Report.
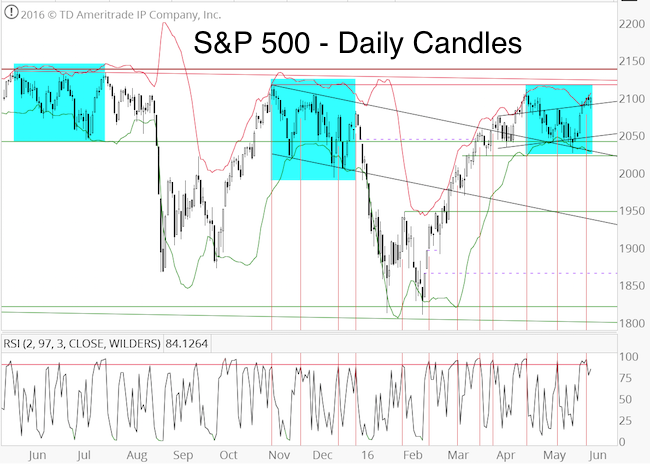
The S&P obviously surpassed the initial up side target, and is now near the next resistance cluster, which gives the bears another shot at taking control.
The chart below shows a number of interesting developments:

-
The S&P is following a pattern similar to May – July, and November – December, 2015 (blue boxes).
-
The S&P reached the upper Bollinger Band for the first time since its April high.
-
The S&P is overbought based on 2-day RSI (see vertical red lines).
-
The CBOE Equity Put/Call Ratio dropped to 0.51, the lowest reading since July 30, 2015 (not shown).
None of the above patterns guarantee a break down, but they show that risk is rising. Rising risk translates into opportunity for bears.
If you enjoy quality, hand-crafted research, >> Sign up for the FREE iSPYETF Newsletter
Misconceptions
According to two CNBC headlines, June is a dangerous month for stocks:
-
May 31, 2016: “June is the worst month for markets” – CNBC
-
June 1, 2016: “This should have you worried about stocks in June” – CNBC
This is only half the truth however. June is also the S&P’s best month during election years.
The percentage of bullish investors polled by Investors Intelligence (II) jumped from 35.40% to 45.40%, one of the biggest one-week increases in 30 years.
At first glance, this appears to be bearish from a contrarian point of view, but history says it isn't.
Similar optimism surges (as long as the percentage of bullish investors stayed below 50%) led to positive returns two months later 12 of 14 times (according to SentimenTrader).
Summary
Courtesy of the latest rally near overhead resistance, bears get another shot at taking control. In fact, there are two possible reversal zones.
Although odds favor (near-term) bearish bets, not all indicators point towards a deep correction. Therefore, precise trade execution and risk management are important to protect against a possible shakeout move.
Continued S&P 500 analysis is available via the Profit Radar Report.
Simon Maierhofer is the founder of iSPYETF and the publisher of the Profit Radar Report. Barron's rated iSPYETF as a "trader with a good track record" (click here for Barron's profile of the Profit Radar Report). The Profit Radar Report presents complex market analysis (S&P 500, Dow Jones, gold, silver, euro and bonds) in an easy format. Technical analysis, sentiment indicators, seasonal patterns and common sense are all wrapped up into two or more easy-to-read weekly updates. All Profit Radar Report recommendations resulted in a 59.51% net gain in 2013, 17.59% in 2014, and 24.52% in 2015.
Follow Simon on Twitter @ iSPYETF or sign up for the FREE iSPYETF Newsletter to get actionable ETF trade ideas delivered for free.

If you enjoy quality, hand-crafted research, >> Sign up for the FREE iSPYETF Newsletter
|