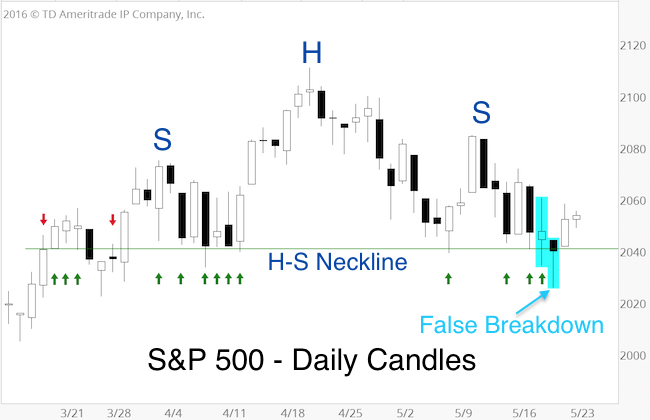
It is rare that a particular stock market support level becomes as obvious as 2,040 for the S&P 500.
Since March 18, the S&P touched 2,040 +/- 13 times, and bounced every time.
As of 2,040 wasn’t already obvious enough, it also became the neckline of a head-and shoulders topping pattern that got a fair amount of attention.

You know something is suspiciously obvious when you read about it everywhere. As the small selection of headlines below shows, S&P 2,040 become a popular ‘make it or break it level.’
-
Investorplace: “S&P 500 Teetering on the Edge of a Breakdown” – The index closed just a fraction of a point from a serious technical violation. The importance of this line (2,040) can’t be overstated. – May 18
-
MarketWatch: “S&P 500 Nails the 2,040 Support ahead of the Fed” – May 18
-
Barron’s: “You shall not Pass: Stocks Gain as S&P 500 Holds 2,040” – May 18
-
TheStreet.com – “S&P Below 2,040 - Looks Like there’s more Selling to Come” – May 19
-
CNBC: “There’s been a lot of talk about the 2,040 level in the S&P 500, that is our key support.” – May 20
If It’s Too Obvious …
If it’s too obvious, it’s obviously wrong, at least this was the Profit Radar Report’s take. Below are brief excerpts from the May 15 and May 18 Profit Radar Report:
Barron's rates the iSPYETF as a "trader with a good track record." Click here for Barron's assessment of the Profit Radar Report.
May 15: “Support around 2,040 has become pretty obvious, perhaps too obvious. There is two ways the market may deal with a too obvious setup: 1) By-pass support via a gap down open 2) Seesaw across support and take out stop loss orders before embarking upon the real move. The market may deliver some fakeout moves (or gaps) near the 2,040 zone, but once the fakeout moves/gaps are out of the way, we may get a setup.”
If you enjoy quality, hand-crafted research, >> Sign up for the FREE iSPYETF Newsletter
May 18: “Based on the importance of 2,040, we wouldn’t be surprise to see more ‘market shenanigans’ around 2,040.”
Technical analysis supported the notion of a seesaw across 2,040.
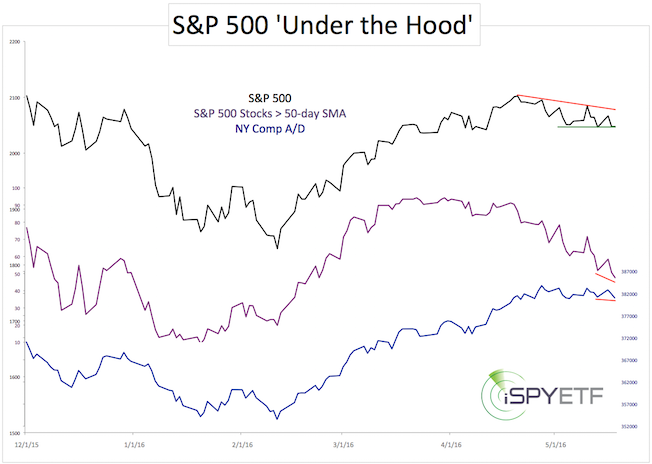
On one hand, there was a bearish divergence between the S&P 500 and two different breadth gauges shown below.

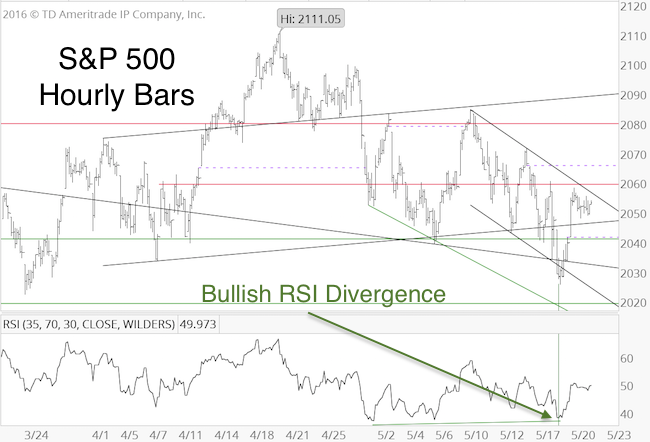
On the other hand, there was the potential for a bullish RSI divergence on the hourly chart.

The Profit Radar Report anticipated a break below 2,040 (due to the bearish divergence), but did not recommend to chase the down side, due to the propensity for a seesaw and the bounce-back potential suggested by the bullish RSI divergence.
Sometimes it's just best to stand aside while the market tries to fool the crowded trade(s). Now, that the market has punished bulls with a stop-loss near 2,040 and bears who went short on a break below 2,040, it may be ready for its next move.
Resistance (and an open chart gap) is just around 2,065, and we know for sure where the next support is, or do we?
Continued S&P 500 analysis is available via the Profit Radar Report.
Simon Maierhofer is the founder of iSPYETF and the publisher of the Profit Radar Report. Barron's rated iSPYETF as a "trader with a good track record" (click here for Barron's profile of the Profit Radar Report). The Profit Radar Report presents complex market analysis (S&P 500, Dow Jones, gold, silver, euro and bonds) in an easy format. Technical analysis, sentiment indicators, seasonal patterns and common sense are all wrapped up into two or more easy-to-read weekly updates. All Profit Radar Report recommendations resulted in a 59.51% net gain in 2013, 17.59% in 2014, and 24.52% in 2015.
Follow Simon on Twitter @ iSPYETF or sign up for the FREE iSPYETF Newsletter to get actionable ETF trade ideas delivered for free.

If you enjoy quality, hand-crafted research, >> Sign up for the FREE iSPYETF Newsletter
|