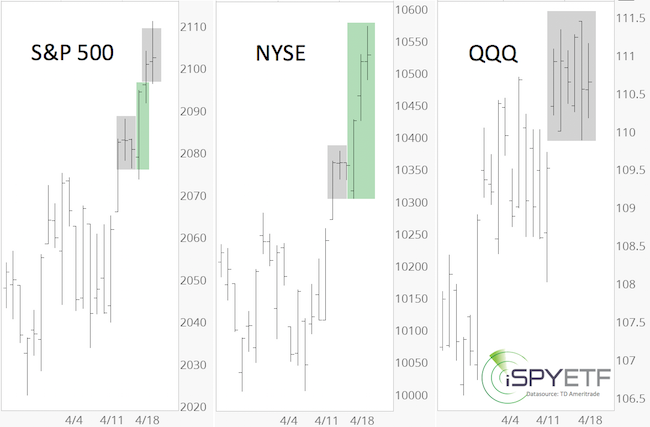
Large cap technology stocks - the notorious US stock market ‘alpha male’ – is trailing behind.
The chart below plots the Nasdaq-100 (represented by the QQQ ETF – right graph) against the S&P 500 and NYSE Composite.

QQQ has been stuck in neutral, while the S&P 500 and NYSE move ahead in second and third gear.
What does this mean for the stock market in general?
We’ve probably been conditioned to believe that large tech underperformance is bad for the broad market. And over the short-term (1-4 weeks), historical performance numbers support this conclusion.
Over the long-term (3-12 months) however, large tech underperformance is actually positive for the overall market. How come?
There are probably several plausible explanations, here is mine:
‘Bullish Ointment’
Since the very beginning of this rally, the Profit Radar Report pointed out the remarkable strength of the post February 11 meltup:
February 17 PRR: “The rally of last Thursday’s low at 1,810 has been very strong. Historically, this kind of ‘escape velocity’ can potentially carry stocks higher for months.”
February 21 PRR: “From February 12 – 17, the S&P 500 gained more than 1.5% a day for three days in a row. Since 1970, this has happened only eight other times. One year later, the S&P 500 traded higher every time, with an average gain of 19.16%.”
March 20, PRR: “Although the S&P 500 is still 3.16% below its November 3, 2015 intraday high at 2,116.48 (and 4% below its all-time high), the NY Composite a/d line already surpassed its November 3, 2015 high. While the S&P retraced only 78.6% of its prior losses, the NYC a/d line already retraced 117.83%. This data suggests that the rally from the February 11, 2016 low is stronger than the rallies from the September 2015 and October 2014 lows.”
If you enjoy quality, hand-crafted research, >> Sign up for the FREE iSPYETF Newsletter
A strong rally is like the proverbial tide that lifts all boats. Unlike other rallies in 2014 and 2015, which were more selective, this rally is actually ‘lifting all boats.’
The NYSE Composite Index consists of some 1,900 stocks (large, mid, small-cap stocks). The Nasdaq-100 of only 100 large cap tech stocks.
The fact that the NYSE Composite started to outperform the QQQs shows that liquidity is penetrating all corners of the market. That’s a good long-term sign.
Fly in the Ointment
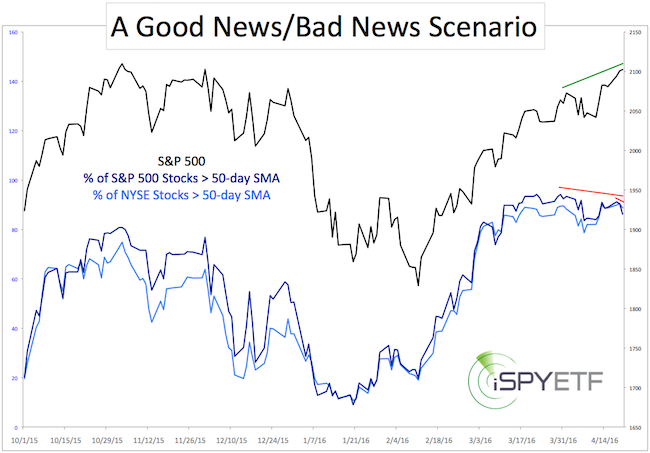
However, there is a bearish fly in the bullish ointment. The second chart plots the S&P 500 against the percentage of S&P 500 and NYSE stocks above their 50-day SMA.

The percentage of NYSE stocks above their 50-day SMA has been stronger than the percentage of S&P 500 stocks, which confirms the strength of the broader, more diversified NYSE composite.
As of Wednesday’s close, the percentage of NYSE stocks failed to confirm the new S&P 500 (and NYSE Composite) recovery highs (short red line). The percentage of S&P 500 stocks above their 50-day SMA has been lagging since March 30 (longer red line).
All the strong breadth reading throughout this rally confirmed our February 11 buy signal.
Although we anticipated a temporary pullback, the April 3 Profit Radar Report stated that a break below 2,040 is needed as the first step towards confirming further weakness.
Staying above support, combined with the long-term bullish developments registered in recent weeks/months has buoyed the S&P 500 higher (the rally from the February low looks like a micro copy of the 2013 rally).
Unless the bearish divergences mentioned above are erased, the S&P 500 is nearing another inflection zone that may rebuff stocks for a little while. Also keep an eye on the open QQQ gap. Risk will increase once this gap is closed.
Continued updates are available via the Profit Radar Report. Barron's graded iSPYETF (and the Profit Radar Report) a "trader with a good track record."
Simon Maierhofer is the founder of iSPYETF and the publisher of the Profit Radar Report. Barron's rated iSPYETF as a "trader with a good track record" (click here for Barron's profile of the Profit Radar Report). The Profit Radar Report presents complex market analysis (S&P 500, Dow Jones, gold, silver, euro and bonds) in an easy format. Technical analysis, sentiment indicators, seasonal patterns and common sense are all wrapped up into two or more easy-to-read weekly updates. All Profit Radar Report recommendations resulted in a 59.51% net gain in 2013, 17.59% in 2014, and 24.52% in 2015.
Follow Simon on Twitter @ iSPYETF or sign up for the FREE iSPYETF Newsletter to get actionable ETF trade ideas delivered for free.

If you enjoy quality, hand-crafted research, >> Sign up for the FREE iSPYETF Newsletter
|