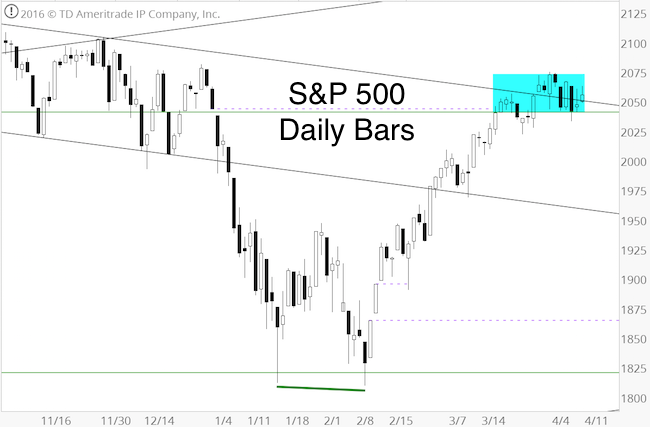
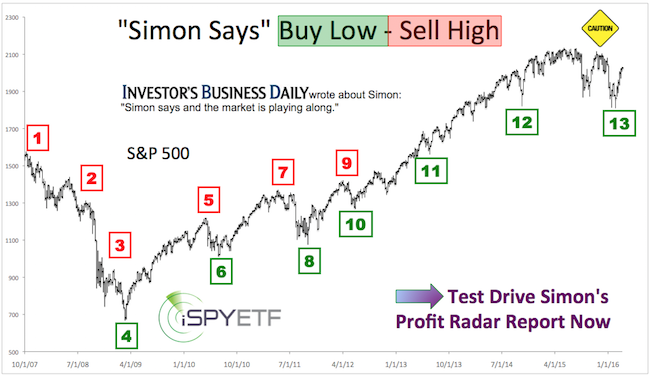
On February 11, the Profit Radar Report recommended to buy the S&P 500 at 1,828 (or SPY at 183). The projected up side target at the time was 2,040.
Barron's rates the iSPYETF as a "trader with a good track record." Click here for Barron's assessment of the Profit Radar Report.
The blue box highlights the S&P’s performance since reaching our up side target.

In general, the market operates in one of three modes:
-
Trending
-
Trendless
-
Reversing
Following the strong up trend from the February low, the market went trendless 16 trading days ago.
Quite frankly, we anticipated a deeper pullback after the 2,040 target was reached.
The April 3 Profit Radar Report mentioned a couple of bearish divergences at the 2,075 recovery high, but stated that a break below 2,040 is needed as confirmation for a deeper pullback.
As it stands right now, the S&P is (above 2,040 and) in limbo. Here are a few points to consider:
Bullish/bearish scenario: The recent sideways action could be a wave 4 according to Elliott Wave Theory (EWT). Waves 4 are sideways affairs. In terms of classic technical analysis, EWT waves 4 often act similar to triangles.
Waves 4 are followed by wave 5 up. A complete 5-wave rally is followed by a larger correction.
Bearish/bullish scenario: The April 1 high created a bearish divergence between price and the percentage of S&P 500 stocks above their 50-day SMA and the hourly RSI.
This may continue to drag stocks lower. However, once prices are low enough, we’d be interested to buy.
Summary
Our indicators stopped providing a cohesive directional signal when the S&P first hit 2,040.
In hindsight, this explains the trading range since. Unfortunately, there is still no cohesive directional signal.
This is a 'one cookie now, or two cookies later' market where patience tends to be rewarded. More often than not, this means it’s best to sit on the sidelines. We will consider buying at lower prices or (short) selling at higher prices.
The next best setup will be discussed via the Profit Radar Report.
Simon Maierhofer is the founder of iSPYETF and the publisher of the Profit Radar Report. Barron's rated iSPYETF as a "trader with a good track record" (click here for Barron's profile of the Profit Radar Report). The Profit Radar Report presents complex market analysis (S&P 500, Dow Jones, gold, silver, euro and bonds) in an easy format. Technical analysis, sentiment indicators, seasonal patterns and common sense are all wrapped up into two or more easy-to-read weekly updates. All Profit Radar Report recommendations resulted in a 59.51% net gain in 2013, 17.59% in 2014, and 24.52% in 2015.
Follow Simon on Twitter @ iSPYETF or sign up for the FREE iSPYETF Newsletter to get actionable ETF trade ideas delivered for free.

If you enjoy quality, hand-crafted research, >> Sign up for the FREE iSPYETF Newsletter
|