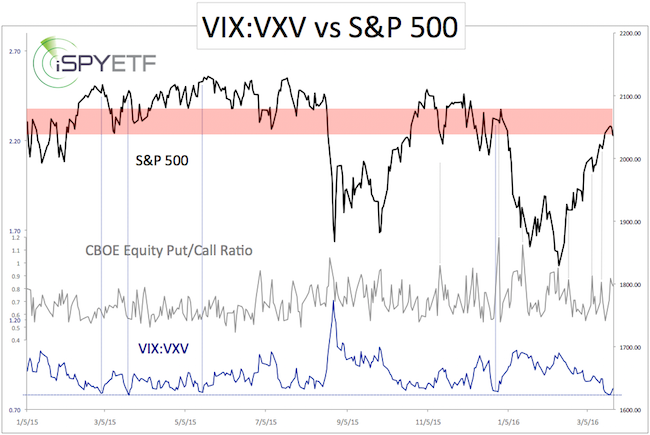
Last week the VIX traded at the lowest level since November, but the VIX:VXV ratio dropped to 0.78. Readings below 0.80 are extremely rare.
The VIX reflects anticipated volatility over the 30 days. The VXV reflects anticipated volatility over the next three months.
The expectation of increased mid-term volatility (VXV) relative to short-term volatility (VIX) is usually a contrarian indicator.
In other words, when investors expect short-term volatility to remain subdued, the market delivers the opposite.
The chart below plots the S&P 500 against the VIX:VXV ratio. As the dotted blue lines show, low VIX:VXV ratio levels tend to spell trouble for stocks.

The only unusual development is that the CBOE Equity put/call ratio is relatively elevated. A rising CBOE Equity put/call ratio tends to coincide with lows.
If you enjoy quality, hand-crafted research, >> Sign up for the FREE iSPYETF Newsletter
What do we make of all this?
The S&P 500 reached an obvious resistance zone last week. The VIX:VXV ratio suggests lower prices. It makes sense to expect further weakness. The elevated put/call ratio may delay/soften the effect of the VIX signal or cause any pullback to become more choppy.
Simon Maierhofer is the publisher of the Profit Radar Report. The Profit Radar Report presents complex market analysis (S&P 500, Dow Jones, gold, silver, euro and bonds) in an easy format. Technical analysis, sentiment indicators, seasonal patterns and common sense are all wrapped up into two or more easy-to-read weekly updates. All Profit Radar Report recommendations resulted in a 59.51% net gain in 2013, 17.59% in 2014, and 24.52% in 2015.
Follow Simon on Twitter @ iSPYETF or sign up for the FREE iSPYETF Newsletter to get actionable ETF trade ideas delivered for free.

If you enjoy quality, hand-crafted research, >> Sign up for the FREE iSPYETF Newsletter
|