There’s been a lot of talk about a super bearish long-term formation called a rounding top.
The bearish rounding top interpreation has been circulating for months, but particularly gathered steam near the January/February lows, when even more market pundits jumped on the already crowded bear market wagon.
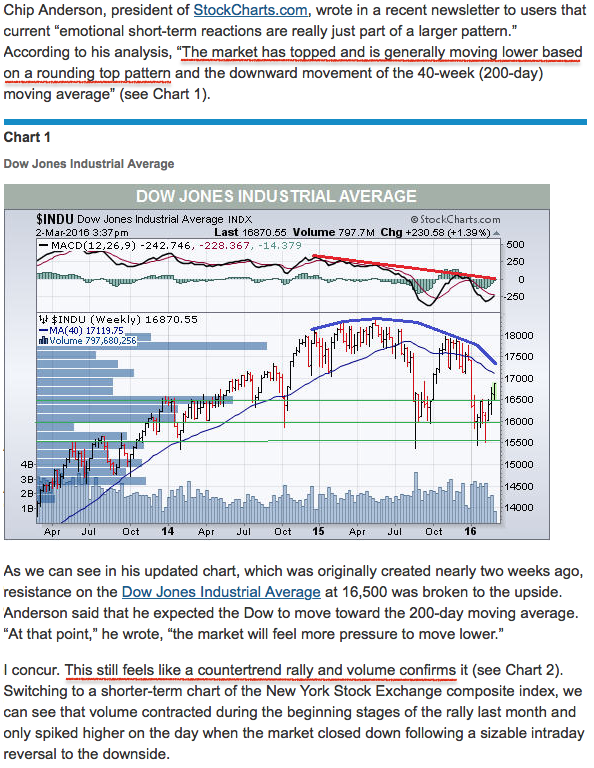
Below is just one of many rounding top articles. This one was featured in Barron’s on March 2, 2016. It points out two bearish patterns:
-
Rounding top
-
Low trading volume
* * * * * * * * * *

* * * * * * * * * *
Rounding Top – R.I.P.?
The Profit Radar Report never even mentioned the rounding top pattern in its analysis, for two reasons:
-
Everyone was talking about it. The market likes to surprise investors not fulfill their expectations.
-
According to many ‘pros’, a rounding top sent stocks into a tailspin in 2000 and 2007. It would have been highly unlikely for the market to deliver the same pattern three times in a row.
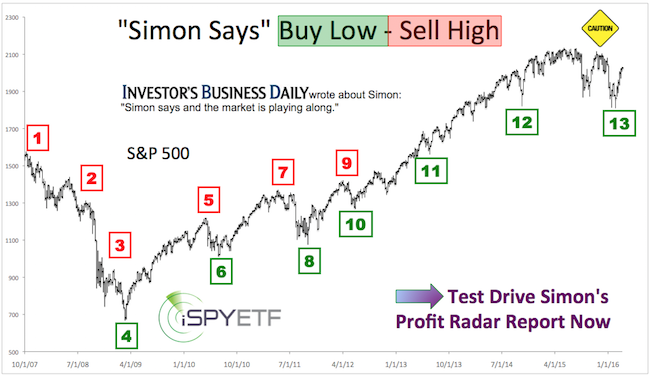
Contrary to this bearish doom-and-gloom pattern, the February 11 Profit Radar Report recommended to buy and issued an up side target of 2,040 (S&P 500).
What’s the status of the rounding top pattern?
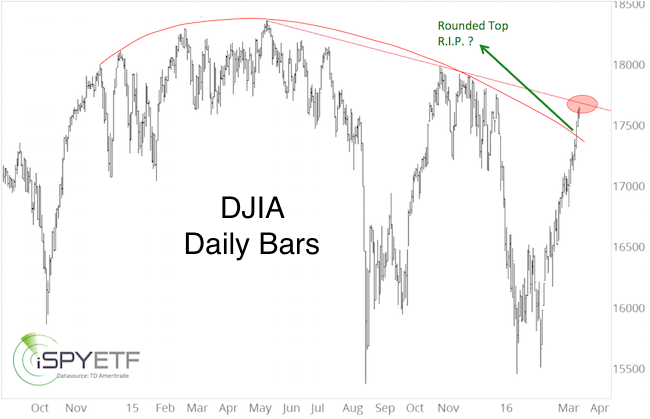
The chart below shows that the Dow Jones Industrials Average (DJIA) moved above the rounding top resistance.

On March 19, Chip Anderson with Stockcharts.com declared the rounding top pattern R.I.P.
Low Volume Doesn’t Matter
The Barron’s article mentioned the bearish implications of low trading volume.
Technical analysis 101 teaches that low volume rallies are doomed to fail, but the fact is that every single rally leg since the 2009 market low has been on low volume.
If you enjoy quality, hand-crafted research, >> Sign up for the FREE iSPYETF Newsletter
My analysis published here on MarketWatch shows that low trading volume is basically meaningless. In fact, as the article shows, volume patterns actually helped us predict some of the mini-meltups that ultimately carried the S&P 500 above 2,040.
More Important than the Rounding Top
More pertinent than the rounding top resistance is the red trend line resistance that connects all recent DJIA spikes.
Furthermore, prior to yesterday’s small loss, the DJIA logged seven consecutive daily gains. This rally pushed every single DJIA component above its 10, 20 and 50-day SMA.
Historically, this is a sign of long-term strength, but tends to result in short-term weakness (to digest the overbought condition). In summary, there's reason to expect a pullback, but such weakness may be more temporary than many anticipate.
Continuous stock market updates will be available via the Profit Radar Report.
Simon Maierhofer is the publisher of the Profit Radar Report. The Profit Radar Report presents complex market analysis (S&P 500, Dow Jones, gold, silver, euro and bonds) in an easy format. Technical analysis, sentiment indicators, seasonal patterns and common sense are all wrapped up into two or more easy-to-read weekly updates. All Profit Radar Report recommendations resulted in a 59.51% net gain in 2013, 17.59% in 2014, and 24.52% in 2015.
Follow Simon on Twitter @ iSPYETF or sign up for the FREE iSPYETF Newsletter to get actionable ETF trade ideas delivered for free.

If you enjoy quality, hand-crafted research, >> Sign up for the FREE iSPYETF Newsletter
|