2016 has seen a renaissance for gold and silver. But just as the luster started to return (and investors piled back into the GLD ETF), the rally stalled.
What’s next?
Gold
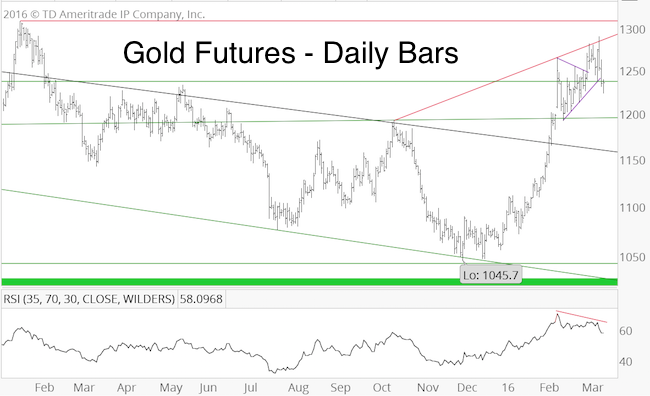
The March 2 Profit Radar Report identified a triangle and stated:
“Upon completion, triangles often lead to strong, but temporary breakouts. A quick spike to 1,300 +/- could mark the end of the initial up leg from the December low. Such a quickly reversed spike higher followed by a multi-week/months correction would harmonize to a satisfactory degree with seasonality and sentiment. A break above 1,255 would be the first steps towards a post-triangle spike.”
The chart below shows the triangle (purple lines) and other resistance levels followed by the Profit Radar Report. There is also a bearish RSI divergence at the latest high.

This explains why gold has fallen since its 1,290 spike high.
A deeper correction, likely followed by another rally leg is likely. Correction low and rally high targets are available via the Profit Radar Report.
If you enjoy quality, hand-crafted research, >> Sign up for the FREE iSPYETF Newsletter
Silver
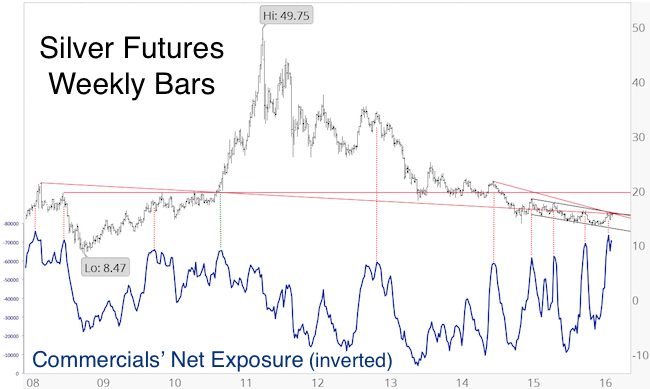
The long-term silver chart (initially published in the February 21 Profit Radar Report) explains why silver is struggling to move higher.

-
Various technical resistance levels converge around 15.7 – 16.
-
Commercial hedgers are record bearish.
Commercial hedgers (the smart money) have the highest short exposure since 2008. History (in particular recent history) says this is bad news for silver. The only time commercial hedgers were wrong was late 2010 when silver entered its blow-off stage.
While we anticipate more gains for silver later in 2016, sentiment and seasonality will make it very difficult for silver to rack up further gains in the near future.
It would take a strong catalyst to drive gold/silver prices higher and void bearish sentiment and seasonality. The risk is to the down side for now.
Continuous gold and silver analysis is available via the Profit Radar Report.
Simon Maierhofer is the publisher of the Profit Radar Report. The Profit Radar Report presents complex market analysis (S&P 500, Dow Jones, gold, silver, euro and bonds) in an easy format. Technical analysis, sentiment indicators, seasonal patterns and common sense are all wrapped up into two or more easy-to-read weekly updates. All Profit Radar Report recommendations resulted in a 59.51% net gain in 2013, 17.59% in 2014, and 24.52% in 2015.
Follow Simon on Twitter @ iSPYETF or sign up for the FREE iSPYETF Newsletter to get actionable ETF trade ideas delivered for free.

If you enjoy quality, hand-crafted research, >> Sign up for the FREE iSPYETF Newsletter
|