The P/E ratio is based on profits and only reliable as long as the “P” in P/E are actual profits. In a world where Wall Street thrives on manipulation, do P/E ratios still apply?
To illustrate: Wells Fargo is trading around $33 a share with earnings per share of $3.18 and a P/E ratio of 10.40. This is cheap, isn’t it?
But how do we know that Wells Fargo’s profit is really $3.18 a share?
As of December 30, 2011, Wells Fargo had total assets of $1.313 trillion and total liabilities of $1.173 trillion. You and I don’t know what the assets and liabilities are, and I venture to say that Wells Fargo doesn’t even know.
How much are the millions of homes Wells Fargo financed before the housing bust really worth? Again, we don’t know, but we know that due to an FASB (Financial Accounting Standard Board) rule change, Wells Fargo and every other corporation in the U.S. can now overstate the value of their under water assets.
FASB Rule 157
FASB rule 157 applies to fair value (or mark-to-market) accounting. Fair value is (or used to be) defined as “the price that would be received to sell an asset or paid to transfer liability in an orderly transaction between market participants.”
In 2008 the market turned disorderly and on April 9, 2009, the FASB (strong armed by Congress) changed rule 157 to suspend the fair value rules when the market is unsteady.
Instead of reporting the current value of an asset (market-to-market), corporations are now allowed to pick a price they believe the asset will be worth in the future (mark-to-make-believe).
Cause and Effect
What effect would this have? A March 2009 Bloomberg published this assessment:
“By letting banks use internal models instead of market prices and allowing them to take into account the cash flow of securities, FASB’s change could boost bank industry earnings by 20 percent. Companies weighed down by mortgage-backed securities, such as New York-based Citigroup, could cut their losses by 50 percent to 70 percent, said Richard Dietrich, an accounting professor at Ohio State University in Columbus. ‘This could turn net losses into significant net gains,” Dietrich said.’”
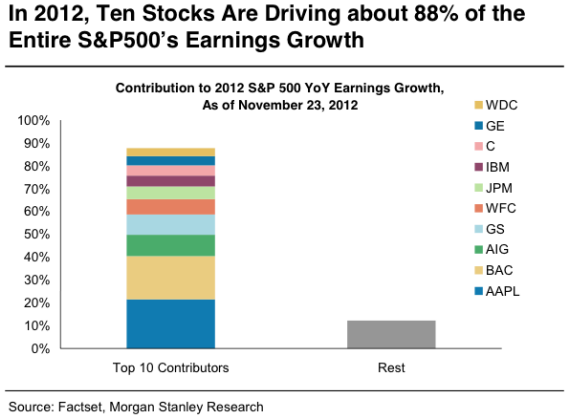
Is that really what happened? Let’s see which companies drove earnings growth for the S&P 500 in 2012.
The chart and data below was compiled by Morgan Stanley’s Adam Parker. According to his research, ten stocks are driving about 88% of the entire S&P 500 earnings growth.

Six (seven if you consider GE a financial stock) of the ten companies belong to the financial sector (Bank of America, AIG, Goldman Sachs, Wells Fargo, JPMorgan Chase, Citigroup).
Without Apple and the financial sector, earnings growth for the S&P 500 would be next to zero. A bad year for Apple and a return to fair value accounting could easily double the P/E ratio.
Based on P/E ratios, does the S&P 500 still look cheap?
|