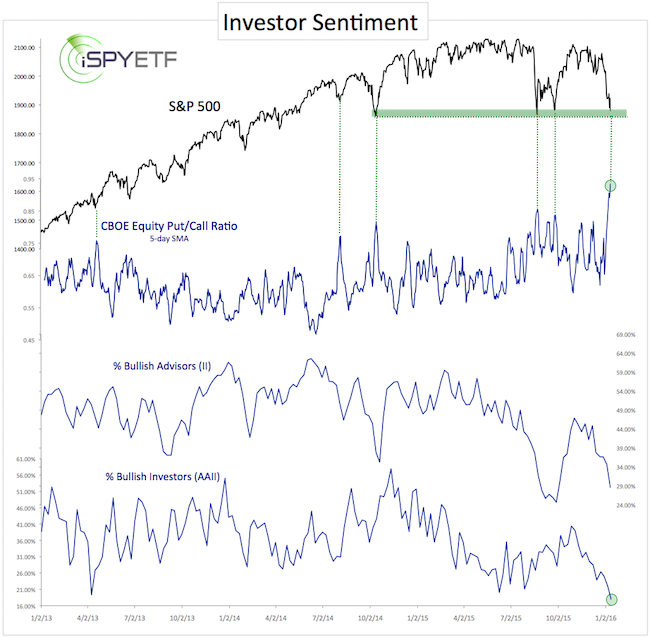
For the fourth time since October 2014, the S&P 500 is testing the mid-1,800s.
That’s right about where investors threw in the towel before, and with regret watched the S&P move higher.
Will it be the same this time around?
The chart below plots the S&P 500 against the CBOE Equity put/call ratio, the percentage of bullish advisors and newsletter-writing colleagues polled by Investors Intelligence (II), and the percentage of bullish retail investors (polled by the American Association for Individual Investors – AAII).

As a composite, those three groups are about as bearish as they were near prior S&P lows. In fact, the CBOE Equity put/call ratio soared to a multi-year high on Friday, and the percentage of bullish investors is at a 10-year low.
If you enjoy quality, hand-crafted research, >> Sign up for the FREE iSPYETF Newsletter
Sentiment suggests that stocks are ripe for a rally, but this would be the fourth time the S&P is following the same script (bounce in the 1,800s). Is it time for a curveball?
The January 19 Profit Radar Report warned that a break below support at 1,870 would result in a quick drop to 1,820 and provided a long-term perspective on the S&P 500 (has a major market top been struck or not?) along with a short-term forecast.
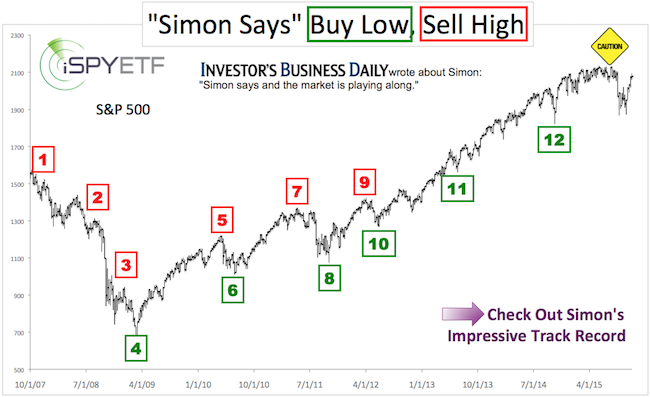
Simon Maierhofer is the publisher of the Profit Radar Report. The Profit Radar Report presents complex market analysis (S&P 500, Dow Jones, gold, silver, euro and bonds) in an easy format. Technical analysis, sentiment indicators, seasonal patterns and common sense are all wrapped up into two or more easy-to-read weekly updates. All Profit Radar Report recommendations resulted in a 59.51% net gain in 2013 and 17.59% in 2014.
Follow Simon on Twitter @ iSPYETF or sign up for the FREE iSPYETF Newsletter to get actionable ETF trade ideas delivered for free.

If you enjoy quality, hand-crafted research, >> Sign up for the FREE iSPYETF Newsletter
|