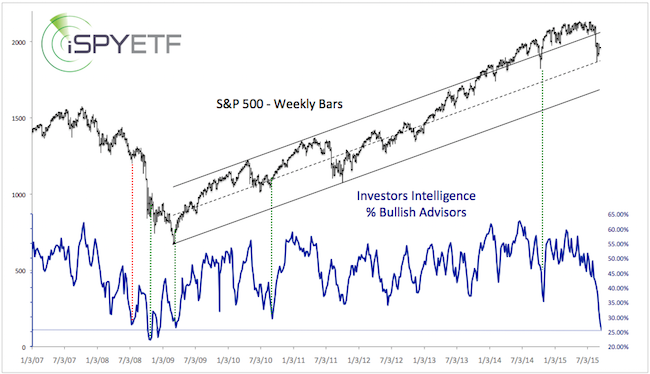
Investment advisors and newsletter-writing colleagues are as bearish right now as they were in March 2009, when the S&P briefly struck 666.
Yes, a quick 12% drop in 2015 caused the same fear as the biggest financial crisis since the Great Depression.
Ok, perhaps (even probably) that’s an exaggeration, but the investment pros (polled by Investors Intelligence) show the same fear now as they did at the end of the financial crisis. No matter how you slice it, that’s pretty remarkable.
The chart below, which plots the S&P 500 against the percentage of bullish investment advisors, offers a glimpse into advisors' collective mind. 3 out of 4 advisors recommend staying away from stocks.

The dashed green lines mark similar investor sentiment extremes, which were not long-term bearish for stocks.
If you enjoy quality, hand-crafted research, >> Sign up for the FREE iSPYETF Newsletter
The only potential exception was a somewhat similar reading in July 2008 (dashed red line). But even this one sparked a notable rally before the bottom fell out.
Does this mean stocks can’t go any lower? By no means. But a drop below or test of the August 2015 panic lows may be a trap for bears.
That’s at least what this S&P 500 template (which also predicted the sharp August selloff) implies.
Simon Maierhofer is the publisher of the Profit Radar Report. The Profit Radar Report presents complex market analysis (S&P 500, Dow Jones, gold, silver, euro and bonds) in an easy format. Technical analysis, sentiment indicators, seasonal patterns and common sense are all wrapped up into two or more easy-to-read weekly updates. All Profit Radar Report recommendations resulted in a 59.51% net gain in 2013 and 17.59% in 2014.
Follow Simon on Twitter @ iSPYETF or sign up for the FREE iSPYETF Newsletter to get actionable ETF trade ideas delivered for free.

If you enjoy quality, hand-crafted research, >> Sign up for the FREE iSPYETF Newsletter
|