A rip current is a powerful, fast-moving flow of water running from the beach back to the open ocean. About 80% of lifeguard rescues are related to rip currents, and about 150 people are killed by rip currents every year (just in the US).
Lifeguards and experienced swimmers/surfers can detect rip currents, and know what to do, but they are invisible to novice swimmers.
The stock market is full of rip currents, that’s why some investors sink (often because they don’t think) and others swim.
Here are some of the cross currents lurking beneath the surface.
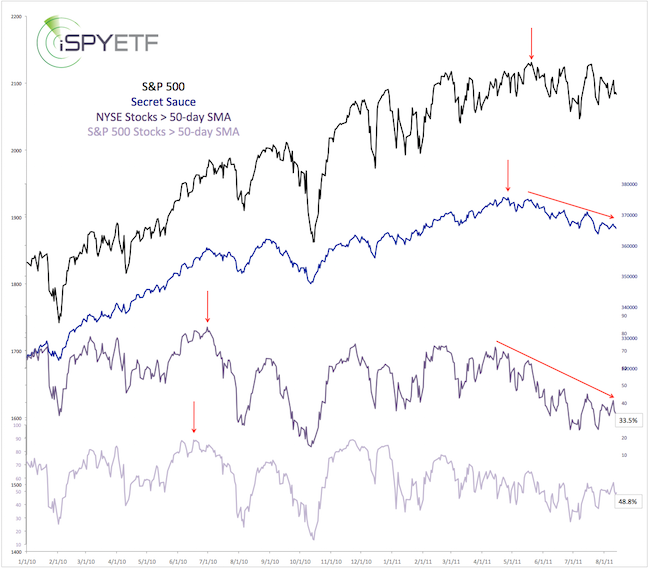
The chart below plots the S&P 500 against the percentage of NYSE and S&P 500 stocks below their 50-day SMA, and my favorite indicator (I call it ‘secret sauce’).

Secret Sauce Warning Signal
Secret sauce is an incredibly potent indicator, and is the most important ‘bull market health meter' I’ve found.
Up until April 2015, secret sauce has been giving the ‘all clear’ signal, meaning that higher highs were still to come (it never triggered a 'danger' signal from 2009 - 2015). That’s not the case anymore.
In fact, currently secret sauce is showing the same warning signals it flashed before the 1987, 2000 and 2007 bear markets.
A detailed description of secret sauce and how it works is available here: The Missing Ingredient for a Major Bull Market Top
Rip Current Warning
The percentage of stocks above their 50-day SMA has been declining since 2012/2013, but the lag accelerated in April.
Large cap stocks are holding up much better than the rest of the market. How so?
48.8% of S&P 500 stocks are above their 50-day SMA, but only 33.5% of NYSE stocks. The NYSE Composite is comprised of some 1,900 issues, including (and predominantly) small and mid cap stocks. The S&P 500 consists of the 500 largest U.S. corporations.
If you enjoy quality, hand-crafted research, >> Sign up for the FREE iSPYETF Newsletter
A quick glance at the Russell 2000 chart, which just dropped to new lows, confirms the lagging performance of small caps.

Small cap underperformance is one of the 3 stages of a dying bull market (click here for the anatomy (3 stages) of a dying bull market).
Market breadth is warning that the stock market is trying to drag investors into open waters.
The percentage of stocks above their 50-day SMA is not yet at rock bottom levels, so there is more down side risk.
However, some investor sentiment measures are showing a high degree of pessimisms (which tends to be positive for stocks).
Bottom line, there is risk, but it seems to be somewhat limited, and will only be triggered by a drop below support (click here for key S&P 500 support).
I would love to see a correction. The deeper the correction, the better the buy signal for a final hurray rally.
If the S&P 500 doesn't bounce soon, despite some excessively bearish sentiment readings, it could be a warning sign that a short-term break down is near.
Simon Maierhofer is the publisher of the Profit Radar Report. The Profit Radar Report presents complex market analysis (S&P 500, Dow Jones, gold, silver, euro and bonds) in an easy format. Technical analysis, sentiment indicators, seasonal patterns and common sense are all wrapped up into two or more easy-to-read weekly updates. All Profit Radar Report recommendations resulted in a 59.51% net gain in 2013 and 17.59% in 2014.
Follow Simon on Twitter @ iSPYETF or sign up for the FREE iSPYETF Newsletter to get actionable ETF trade ideas delivered for free.

If you enjoy quality, hand-crafted research, >> Sign up for the FREE iSPYETF Newsletter
|