The stock market is the best pickpocket in the world. Why? It diverts investors’ intention while smoothly robbing their portfolio.
The Profit Radar Report tries to pay attention to the market’s subtle clues. It monitors many market forces ignored by most participants.
This doesn’t always result in profitable trades, but Profit Radar Report subscribers are rarely completely surprised by the market’s twists and turns.
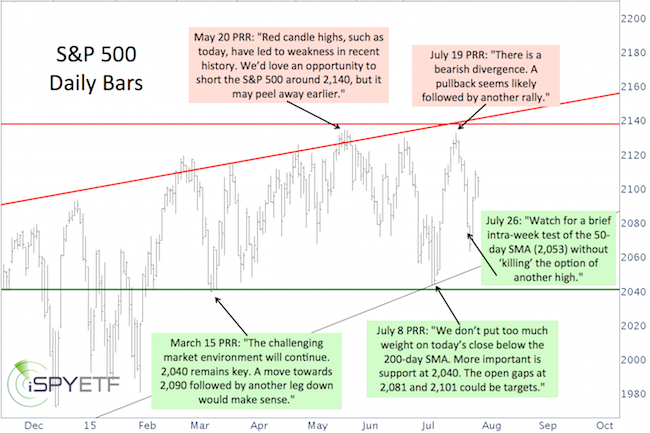
The chart below features a selection of recent Profit Radar Report (PRR) S&P 500 market calls.
If you feel the Profit Radar Report is worth a closer look, click here for more details.

March 15, Profit Radar Report: “The challenging market environment will continue. 2,040 remains key. A move towards 2,090 followed by another leg down would make sense.”
May 20, Profit Radar Report: “Red candle highs, such as today, have led to weakness in recent history. We’d love an opportunity to short the S&P 500 around 2,140, but it may peel away earlier.
July 8, Profit Radar Report: “We don’t put too much weight on today’s close below the 200-day SMA. More important is support at 2,040. The open gaps at 2,081 and 2,101 could be targets.”
July 19, Profit Radar Report: “There is a bearish divergence. A pullback seems likely followed by another rally.”
July 26, Profit Radar Report: “Watch for a brief intra-week test of the 50-day SMA (2,053) without ‘killing’ the option of another high.”
What's Next?
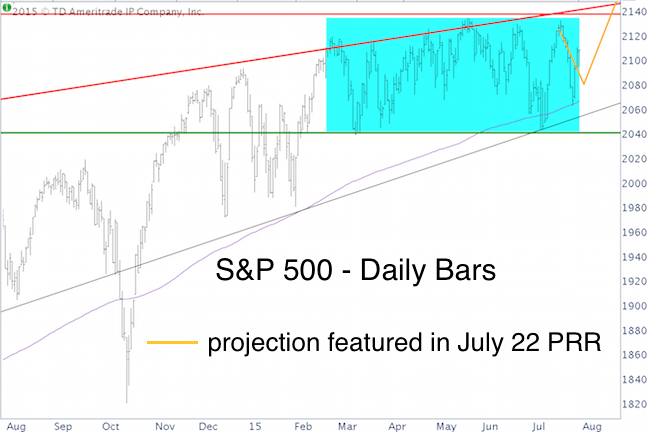
The yellow projection shown below was featured in the July 22 Profit Radar Report.
Whether new highs will be achieved remains to be seen, but any new highs around or above 2,140 would offer the next best opportunity.
A 'false breakout' above 2,140 followed by a relapse below 2,140 would be a low-risk opportunity to go short.
Key support remains around 2,050 (Why 2,050? More details here) and 2,040 (Why 2,040? More details here).

|