Over the past two weeks we explored two developments:
-
Stocks had to rally to flush out premature bears
-
2015 is looking a lot like 2011
A couple of sentiment indicators (such as AAII poll) showed extreme pessimism recently.
2011 saw an 18% drop starting in July.
The question for right now is this: Is there too much pessimism for a summer correction?
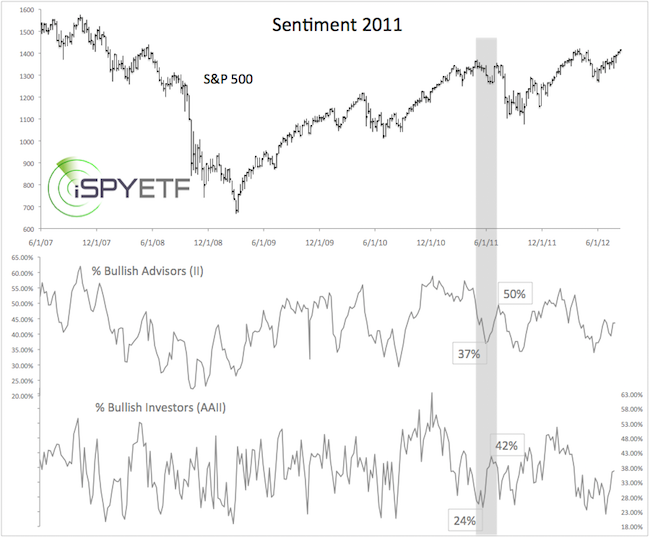
The first chart shows sentiment in 2011. The gray bar highlights June 2011.

By mid-June, investors polled by the American Association for Individual Investors (AAII) and Investors Intelligence (II) had become quite pessimistic. Only 24% and 37% of investors were bullish.
A 7.8% S&P 500 (NYSEArca: SPY) rally from June 16 – July 7 relieved much of that pessimism, but it didn’t take a spike into extreme optimism for stocks to plunge in July.
If you enjoy quality, hand-crafted research, >> Sign up for the FREE iSPYETF Newsletter
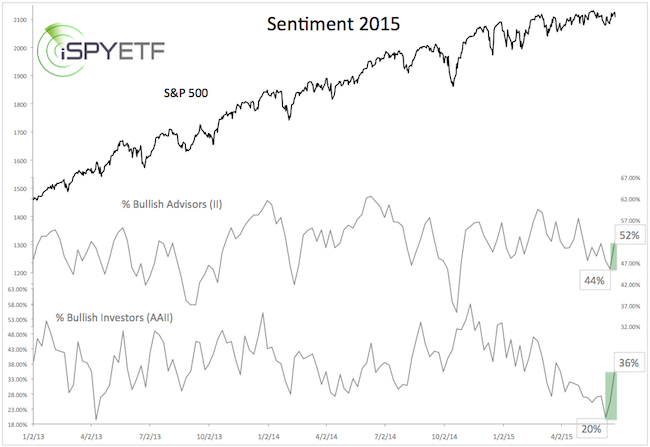
A look at current sentiment shows a similar scenario.
Optimism was quite low (extremely low for the AAII survey), but recovered, no doubt due to the 58-point rally from the June 15 low.

Based on the 2011 analogy, stocks may rally into early July. An updated look at the 2011 vs 2015 analogy is available here: 2015 is Looking a Lot Like 2011
Simon Maierhofer is the publisher of the Profit Radar Report. The Profit Radar Report presents complex market analysis (S&P 500, Dow Jones, gold, silver, euro and bonds) in an easy format. Technical analysis, sentiment indicators, seasonal patterns and common sense are all wrapped up into two or more easy-to-read weekly updates. All Profit Radar Report recommendations resulted in a 59.51% net gain in 2013 and 17.59% in 2014.
Follow Simon on Twitter @ iSPYETF or sign up for the FREE iSPYETF Newsletter to get actionable ETF trade ideas delivered for free.

If you enjoy quality, hand-crafted research, >> Sign up for the FREE iSPYETF Newsletter
|