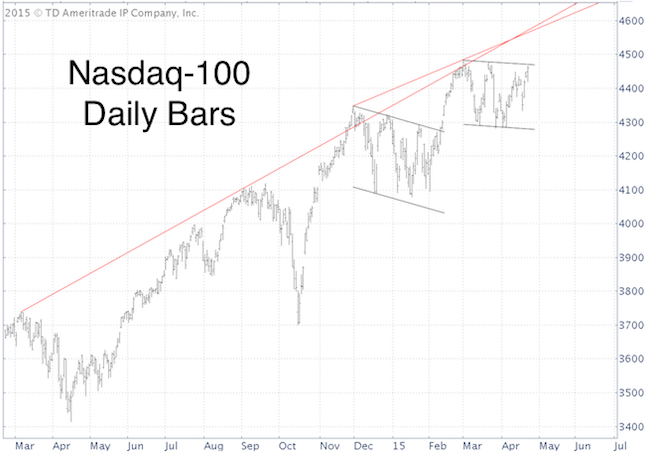
The April 22 Profit Radar Report showed this chart of the Nasdaq-100 and stated:
“There are similarities between AAPL and the Nasdaq-100, which is forming a potential bull flag. A break above 4,465 – 4,485 (corresponding level for QQQ = 109.10) could drive the Nasdaq-100 to next resistance around 4,600. Aggressive investors may buy QQQ with a break above 109.10.”

The bullish breakout materialized, but how legitimate is it?
Never Miss a Beat! >> Sign up for the FREE iSPYETF e-Newsletter
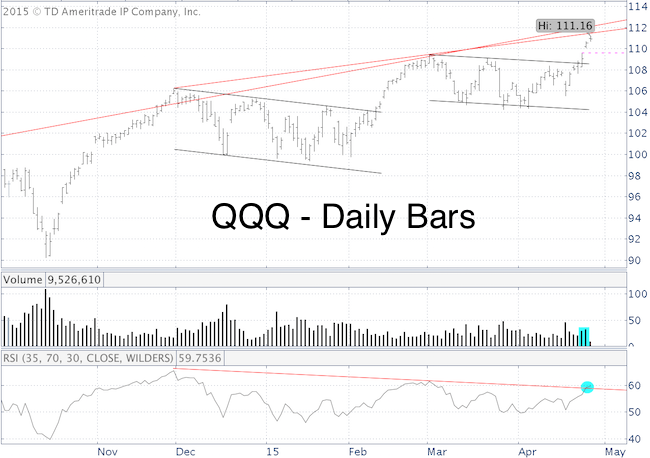
Below is an update chart of the Nasdaq QQQ ETF.

-
The breakout occurred on elevated volume. Bullish.
-
There’s on open chart gap at 109.55, which will probably get filled.
-
There’s a long-term bearish RSI divergence. Potentially bearish.
-
RSI may be about to close above trend line resistance. Potentially bullish.
-
Next resistance at 111.50 – 112.20.
-
Ideal bull flag target is around 112.50.
The trend is up, but lagging breadth and the open chart gap suggest an eventual pullback is likely.
AAPL, the MVP of the Nasdaq and most important stock in the world, shows one of the most fascinating chart formations. More detail here: Fascinating AAPL Chart Formation Telegraphed Bullish Breakout
Simon Maierhofer is the publisher of the Profit Radar Report. The Profit Radar Report presents complex market analysis (S&P 500, Dow Jones, gold, silver, euro and bonds) in an easy format. Technical analysis, sentiment indicators, seasonal patterns and common sense are all wrapped up into two or more easy-to-read weekly updates. All Profit Radar Report recommendations resulted in a 59.51% net gain in 2013 and 17.59% in 2014.
Follow Simon on Twitter @ iSPYETF or sign up for the FREE iSPYETF Newsletter to get actionable ETF trade ideas delivered for free.

Never Miss a Beat! >> Sign up for the FREE iSPYETF e-Newsletter
|