The news-reporting powers to be have determined that rising interest rates are the bull market’s worst enemy.
In fact, the looming threat of rising rates is as unwelcome as the dreaded QE taper used to be. But wait, QE ended many months ago, and stocks are still near their all-time high (see here for detailed analysis of QE effect on stocks).
Could rising interest rates be a moot point (just like the end of QE was)? As we will see in a moment, rising rates are not as scary as many believe.
But first off, how does the Federal Reserve raise interest rates and which interest rate is the one being ‘manipulated’?
What’s the ‘Interest Rate’?
When the Federal Reserve (or the media) talks about raising (or lowering) interest rates, it is talking about the federal funds rate.
The federal funds rate is the central interest rate in the U.S. financial system. It is the interest rate at which depository institutions trade balances held at the Federal Reserve with each other overnight.
Never Miss a Beat! >> Sign up for the FREE iSPYETF e-Newsletter
How Does the Fed ‘Manipulate’ the Interest Rate?
The Federal Reserve sets the target rate. The target rate is currently 0 – 0.25%. The Fed ‘manipulates’ this rate via government bond purchases (i.e. the Federal Reserve reduces liquidity and raises the federal funds rate by selling government bonds).
The actual rate is determined by trading between banks. The weighted average of bank transactions is considered the effective federal funds rate (currently 0.11%).
What Really Matters: How Do Interest Rates Affect Stocks
But what really matters is how the federal funds rate affects stocks.
Here’s what the data says:
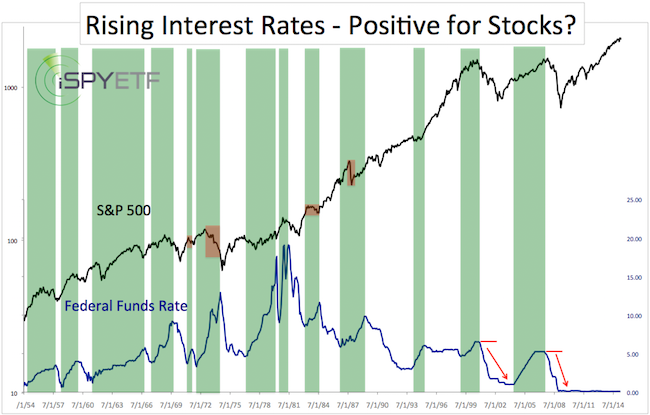
The chart below plots the S&P 500 (NYSEArca: SPY) against the federal funds rate going back to 1954.

Periods of rising interest rates are highlighted in green.
More often than not, the S&P 500 moved higher (or didn’t decline significantly) when interest rates rose. The few exceptions are marked with a red box.
Most recently, the S&P 500 rallied when rates were buoyed starting in 2004 and 1998.
The green areas clearly show that rising rates are not bearish for stocks.
However, it needs to be pointed out that when the stock market rolled over in 2000 and 2007, the Federal Reserve had a lot of room to lower rates and stimulate growth.
That is not the case today. If this economic recovery does not stick, and stocks fall, the Federal Reserve won’t have much room to lower rates. It would take several rate hikes to build up a 'cushion,' that would allow the Fed to lower rates if the economy relapses.
Perhaps that’s why the Federal Reserve has been so hesitant to raise rates, and thereby spook the market.
Rather than focusing on rate hikes, I will continue to monitor the indicator that correctly foreshadowed the 1987, 2000 and 2007 market tops. It also 'told' us consistently since 2010 that this bull market is alive and healthy. Here's what this indicator, which I dubbed 'secret sauce' is telling us right now. Is the S&P 500 Carving Out a Major Market Top?
Simon Maierhofer is the publisher of the Profit Radar Report. The Profit Radar Report presents complex market analysis (S&P 500, Dow Jones, gold, silver, euro and bonds) in an easy format. Technical analysis, sentiment indicators, seasonal patterns and common sense are all wrapped up into two or more easy-to-read weekly updates. All Profit Radar Report recommendations resulted in a 59.51% net gain in 2013 and 17.59% in 2014.
Follow Simon on Twitter @ iSPYETF or sign up for the FREE iSPYETF Newsletter to get actionable ETF trade ideas delivered for free.

Never Miss a Beat! >> Sign up for the FREE iSPYETF e-Newsletter
|