Surfers wait for the next big wave, investors (or traders) wait for the next big move.
Not sure about you, but I suffer from FOMO (fear of missing out). I hate missing a big move, whether it’s in gold, silver, S&P 500 or any other asset.
The next big move is the tangling carrot that keeps people invested (or trading) much of the time.
But patience is a virtue, and sometimes the S&P 500 just doesn’t go anywhere.
I observed the following via the March 8 Profit Radar Report: “Any red flags are in conflict with bullish seasonality from now until May. The result of opposite forces fighting for the upper hand may be a period of sideways trading.”
The S&P 500 today is at the same level where it was on March 8.
All trading ranges, regardless of have long and boring they seem, come to an end eventually. The S&P 500 has reached a zone that could bust the range.
Why? Because it reached a potential inflection point.
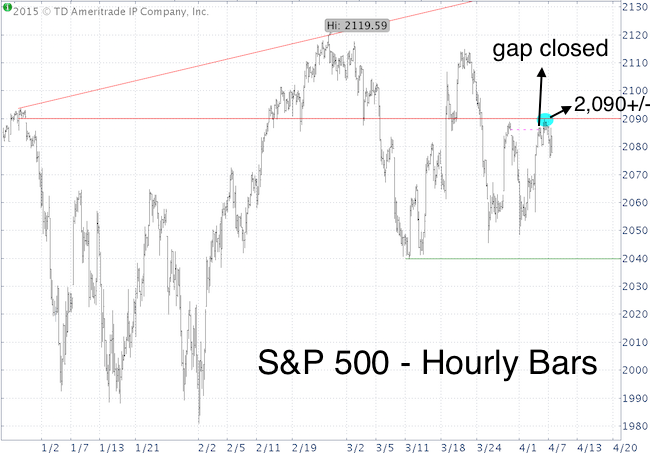
Here is what the April 1 Profit Radar Report proposed: “There’s an open chart gap at 2,086. I favor a rally towards 2,090. We’ll have to look at the structure and buying power behind any such rally, but 2,090 +/- could be a tempting setup to go short.”
Never Miss a Beat! >> Sign up for the FREE iSPYETF e-Newsletter
The S&P moved as high as 2,089.81 on Tuesday. Although Monday’s rally was accompanied by strong breadth, Tuesday’s follow was disappointing and trade stalled.

This inflection point is effective only if the S&P soon peels away from the 2,090+/- zone (this zone extends to 2,100). If it doesn't, we will probably have to consider the entire structure a triangle likely to resolve with an up side thrust.
The triangle remains a viable option as long as trade stays above 2,039 (remember, seasonality is strong until May).
The Profit Radar Report's recommendation for aggressive traders has been to trade the edges of this range (buy against support, sell against resistance). As long as the edges hold, that’s the best approach to kill time (and scalp some profits).
For continued S&P 500 analysis sign up for the Profit Radar Report. The Profit Radar Report delivers hand-crafted out-of-the-box analysis based on proprietary measures of supply/demand, technicals, seasonality and sentiment.
Simon Maierhofer is the publisher of the Profit Radar Report. The Profit Radar Report presents complex market analysis (S&P 500, Dow Jones, gold, silver, euro and bonds) in an easy format. Technical analysis, sentiment indicators, seasonal patterns and common sense are all wrapped up into two or more easy-to-read weekly updates. All Profit Radar Report recommendations resulted in a 59.51% net gain in 2013 and 17.59% in 2014.
Follow Simon on Twitter @ iSPYETF or sign up for the FREE iSPYETF Newsletter to get actionable ETF trade ideas delivered for free.

|