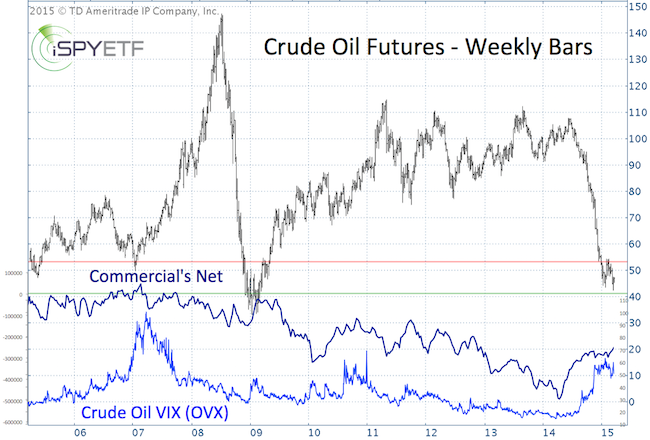
After losing 55% in a matter of six months, oil has been flat for the last two months. Is it gathering steam for the next big move?
A volatile bottoming process is nothing new for oil.
The 1986 and 2008/2009 bottoming processes were volatile as well (2008/2009 highlighted by blue circle). There were many weeks of wild up and down swings.
The initial low wasn’t violated in a meaningful way, but there was also no meaningful progress for about three months.
Based on the 1986 and 2008/2009 script, the February 4 Profit Radar Report anticipated wild, range bound swings.

The VIX for crude oil (OVX – light blue graph) is about at the same level as it was near the 2008/2009 low. If the 2008/2009 Oil VIX high acts as resistance, down side for oil is limited.
The dark blue graph shows the net futures position (Commitment of Traders Report) of commercial traders.
Complex Analysis made easy! >> Sign up for the FREE iSPYETF e-Newsletter
Although not extreme by historical standards, it appears that commercial traders are starting to prepare themselves for further gains.
Oil seasonality also suggests higher prices.
The red and green lines are long-term Fibonacci support/resistance, but probably more important is a trend line that’s been important for oil prices for nearly two decades (this proprietary trend line and detailed oil seasonality chart reserved for subscribers of the Profit Radar Report).
A move above this trend line is likely to trigger a rally.
Before investing in Oil ETFs like the United States Oil Fund (NYSEArca: USO) or iPath Crude Oil ETN (NYSEArca: OIL), investors should know that futures based ETFs (like USO and OIL) are subject to contango, and may lag the underlying asset (in this case oil).
Although this wasn’t the case in February 2015 - when oil prices and USO/OIL gained as much as 24.4% before reversing lower – it’s always good to calibrate expectations.
Simon Maierhofer is the publisher of the Profit Radar Report. The Profit Radar Report presents complex market analysis (S&P 500, Dow Jones, gold, silver, euro and bonds) in an easy format. Technical analysis, sentiment indicators, seasonal patterns and common sense are all wrapped up into two or more easy-to-read weekly updates. All Profit Radar Report recommendations resulted in a 59.51% net gain in 2013 and 17.59% in 2014.
Follow Simon on Twitter @ iSPYETF or sign up for the FREE iSPYETF Newsletter to get actionable ETF trade ideas delivered for free.

|