I invite you to inspect a very insightful S&P 500 chart with me.
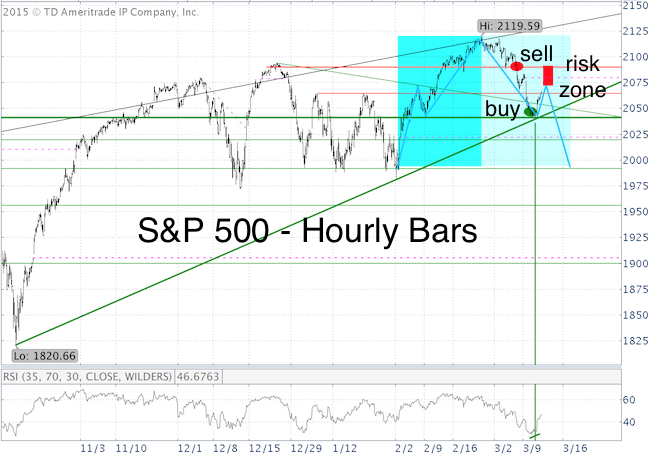
Since February 2nd, the S&P 500 (NYSEArca: SPY) is tracing out a very symmetric pattern (see blue box and blue lines).

The only thing missing to complete a decline that mirrors the February 2 – February 25 rally is another leg down to 2,000.
Will the market complete the pattern?
Patterns like that can break apart at any time. I never rely on just one single pattern or indicator. Here’s what else the chart is telling us:
Prior support at 2,090 is now important resistance. On Friday, March 6, the Profit Radar Report recommended shorting the S&P as soon as 2,087 is violated.
Important support is around 2,040.
Never Miss a Beat! >> Sign up for the FREE iSPYETF e-Newsletter
Wednesday’s Profit Radar Report highlighted the confluence of trend lines and observed that: “The S&P 500 is right about where a bounce becomes likely. The daily and hourly chart peg support around 2,040. There is a small bullish RSI divergence on the hourly chart. At a 1-3 day time frame, a (counter trend) bounce seems likely.”
Per a special intraday update, we closed our S&P short position already at 2,048 on Tuesday for a 39-point gain.
Based on the symmetrical pattern, resistance of the ‘left shoulder’ is around 2,072. There is also an open chart gap at 2,079. And of course there’s resistance at 2,090. This resistance cluster is illustrated via the red zone.
Supply & Demand
Selling pressure leading to Tuesday’s 2,040 low may have been enough to exhaust supply (Tuesday was almost a 90% down day), but buying pressure thus far (Thursday was only a 71% up day) is not indicative of a more lasting low.
Unless buying pressure picks up, and trade moves above 2,090, there’s still above average risk of a down side reversal towards 2,000 (especially if 2,040 gets broken).
The Profit Radar Report will continue to monitor proprietary measures of buying/selling pressure along with investor sentiment, divergences and support/resistance levels to stay ahead of the trend.
>> click here to test drive the Profit Radar Report with a 30-day money back guarantee.
Simon Maierhofer is the publisher of the Profit Radar Report. The Profit Radar Report presents complex market analysis (S&P 500, Dow Jones, gold, silver, euro and bonds) in an easy format. Technical analysis, sentiment indicators, seasonal patterns and common sense are all wrapped up into two or more easy-to-read weekly updates. All Profit Radar Report recommendations resulted in a 59.51% net gain in 2013 and 17.59% in 2014.
Follow Simon on Twitter @ iSPYETF or sign up for the FREE iSPYETF Newsletter to get actionable ETF trade ideas delivered for free.

|